Hit like & follow guys ;)
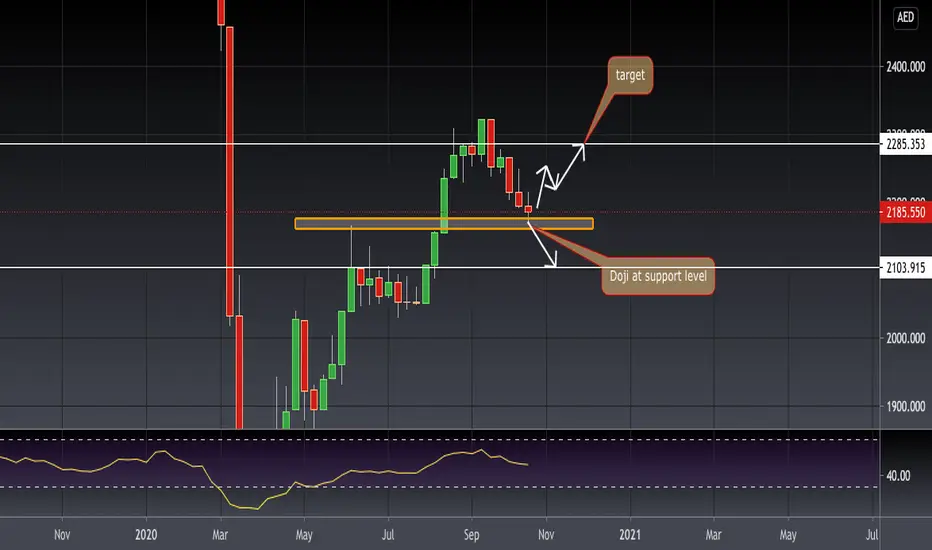
If we analyse weekly chart the uptrend is still intact and we are seeing a perfect doji candle at the support level. Good chances of market continuing its uptrend from this level. If 2185 holds up and if we can see a weekly candle close above 2220 it will be a good sign that market want to go higher. But at the same time if this level does not hold market can quickly slip to 2100 levels. Over all on a bigger time frame it looks bullish.
If we analyse weekly chart the uptrend is still intact and we are seeing a perfect doji candle at the support level. Good chances of market continuing its uptrend from this level. If 2185 holds up and if we can see a weekly candle close above 2220 it will be a good sign that market want to go higher. But at the same time if this level does not hold market can quickly slip to 2100 levels. Over all on a bigger time frame it looks bullish.
免責事項
この情報および投稿は、TradingViewが提供または推奨する金融、投資、トレード、その他のアドバイスや推奨を意図するものではなく、それらを構成するものでもありません。詳細は利用規約をご覧ください。
免責事項
この情報および投稿は、TradingViewが提供または推奨する金融、投資、トレード、その他のアドバイスや推奨を意図するものではなく、それらを構成するものでもありません。詳細は利用規約をご覧ください。