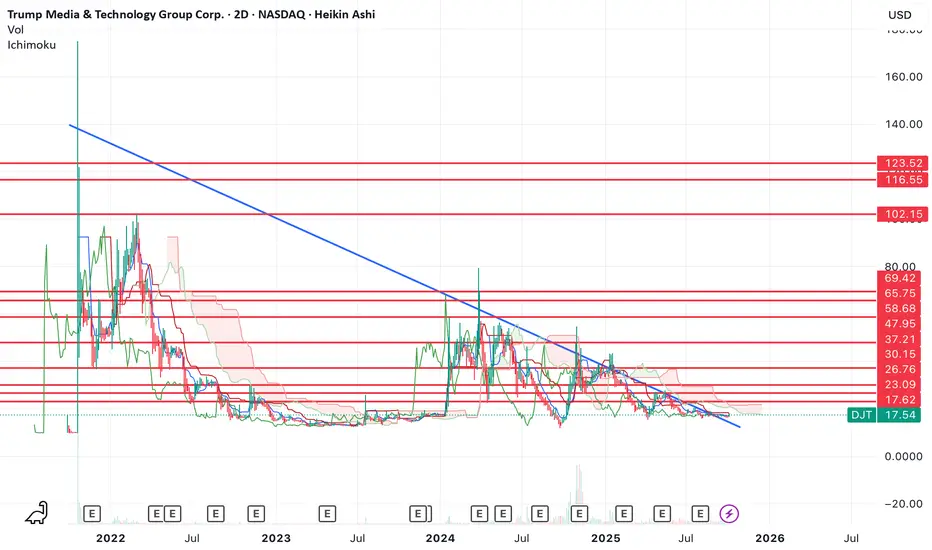
This may sound crazy, but I think we're getting ready to see a massive move in DJT. We've now broken out of a year+ downtrend.
If we look at Heikin ashi candles, we can also see that we've gotten our first weekly green bottom candle indicating the bull trend is now starting on high timeframes.
If DJT can break above the $27 resistance, then I think it can see the resistances at the top of the chart.
Let's see how it performs over the coming weeks.
免責事項
この情報および投稿は、TradingViewが提供または推奨する金融、投資、トレード、その他のアドバイスや推奨を意図するものではなく、それらを構成するものでもありません。詳細は利用規約をご覧ください。
免責事項
この情報および投稿は、TradingViewが提供または推奨する金融、投資、トレード、その他のアドバイスや推奨を意図するものではなく、それらを構成するものでもありません。詳細は利用規約をご覧ください。