IDFC First Bank – Daily Chart Analysis
Timeframe: Daily chart observation.
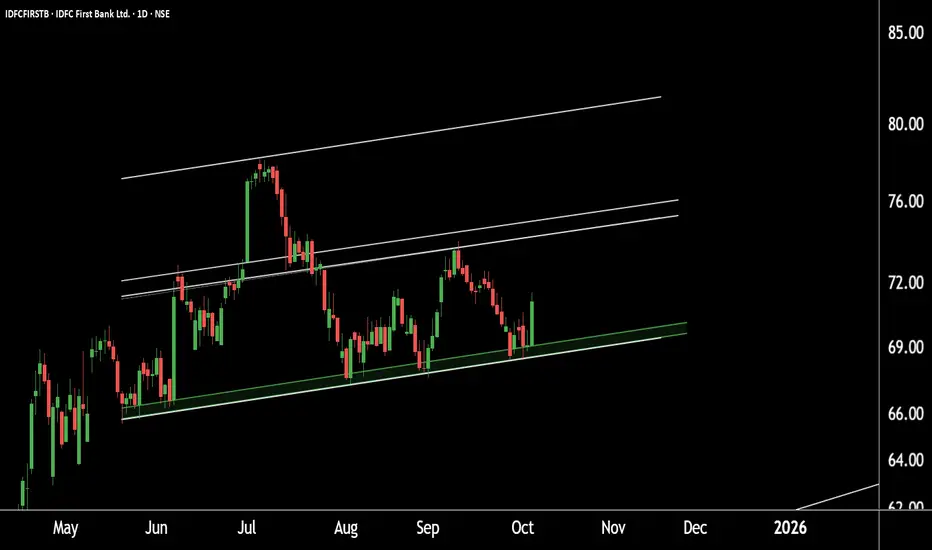
Price Structure: The stock is trading within a well-defined parallel channel.
Support Zone: Strong support identified near the ₹67–₹69 range.
Upside Target: If the support zone holds, the next potential upside target lies around ₹81–₹82.
Outlook: Sustaining above the support levels may lead to higher prices in the upcoming sessions.
Thank you.
Timeframe: Daily chart observation.
Price Structure: The stock is trading within a well-defined parallel channel.
Support Zone: Strong support identified near the ₹67–₹69 range.
Upside Target: If the support zone holds, the next potential upside target lies around ₹81–₹82.
Outlook: Sustaining above the support levels may lead to higher prices in the upcoming sessions.
Thank you.
@RahulSaraoge
Connect us at t.me/stridesadvisory
Connect us at t.me/stridesadvisory
免責事項
この情報および投稿は、TradingViewが提供または推奨する金融、投資、トレード、その他のアドバイスや推奨を意図するものではなく、それらを構成するものでもありません。詳細は利用規約をご覧ください。
@RahulSaraoge
Connect us at t.me/stridesadvisory
Connect us at t.me/stridesadvisory
免責事項
この情報および投稿は、TradingViewが提供または推奨する金融、投資、トレード、その他のアドバイスや推奨を意図するものではなく、それらを構成するものでもありません。詳細は利用規約をご覧ください。