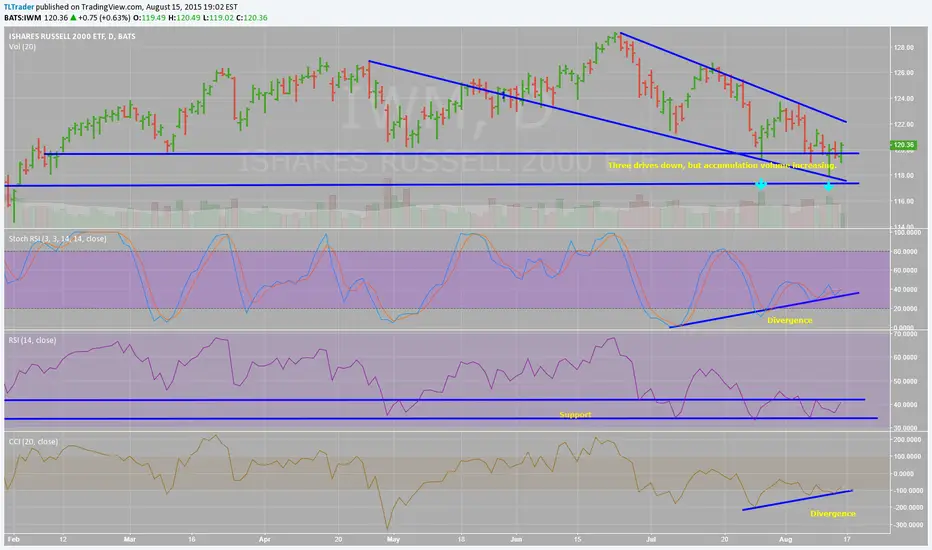
IWM has been under pressure since beginning of July. The chart shown 3 drives down,, a penetration of earlier support and then a quick rebound on 8/12. Volume on strong up days shows accumulation. Oscillators show divergence to price.
I am biased long with a stop at 117.
I am biased long with a stop at 117.
免責事項
これらの情報および投稿は、TradingViewが提供または保証する金融、投資、取引、またはその他の種類のアドバイスや推奨を意図したものではなく、またそのようなものでもありません。詳しくは利用規約をご覧ください。
免責事項
これらの情報および投稿は、TradingViewが提供または保証する金融、投資、取引、またはその他の種類のアドバイスや推奨を意図したものではなく、またそのようなものでもありません。詳しくは利用規約をご覧ください。