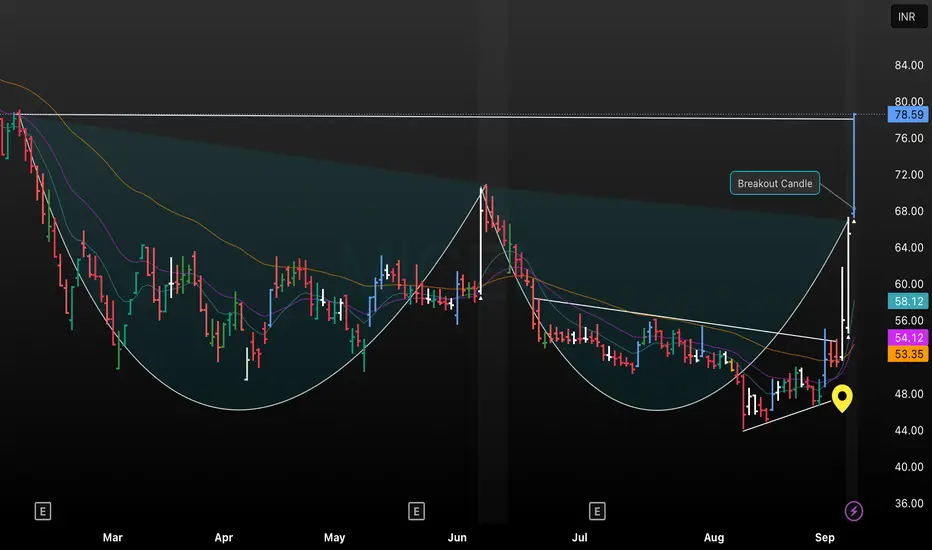
This chart shows the daily price action of MICEL, highlighting a classic cup and handle formation that developed over several months. The highlighted candle marks a strong breakout above the horizontal resistance near ₹78.59, confirming the pattern and signaling bullish momentum. Multiple moving averages are included for added trend analysis; the breakout volume and rapid price move suggest potential for further upside, making this setup significant for momentum traders.
免責事項
これらの情報および投稿は、TradingViewが提供または保証する金融、投資、取引、またはその他の種類のアドバイスや推奨を意図したものではなく、またそのようなものでもありません。詳しくは利用規約をご覧ください。
免責事項
これらの情報および投稿は、TradingViewが提供または保証する金融、投資、取引、またはその他の種類のアドバイスや推奨を意図したものではなく、またそのようなものでもありません。詳しくは利用規約をご覧ください。