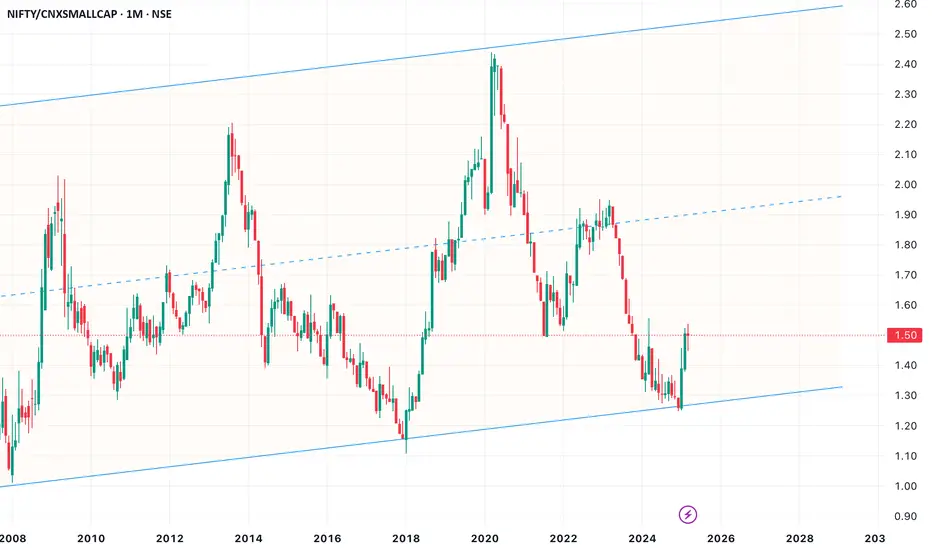
This ratio chart between LargeCaps and SmallCaps has been a good retail sentiment indicator. At the extremes, it has been a good contrarian indicator
When large-cap underperformance reaches an extreme low and starts to reverse, like in 2024 Sep, one of the 3 scenarios unfolds and seems to last 18 to 24 months
1. Both LargeCaps and SmallCaps correct, but SmallCaps correct even more
2. LargeCaps are relatively stable but SmallCaps are correcting
3. LargeCaps are rallying and SmallCaps are yet to catch up
Let's see if Scenario 1 >>> Scenario 2
Ps: This is NOT an investment advice
免責事項
この情報および投稿は、TradingViewが提供または推奨する金融、投資、トレード、その他のアドバイスや推奨を意図するものではなく、それらを構成するものでもありません。詳細は利用規約をご覧ください。
免責事項
この情報および投稿は、TradingViewが提供または推奨する金融、投資、トレード、その他のアドバイスや推奨を意図するものではなく、それらを構成するものでもありません。詳細は利用規約をご覧ください。