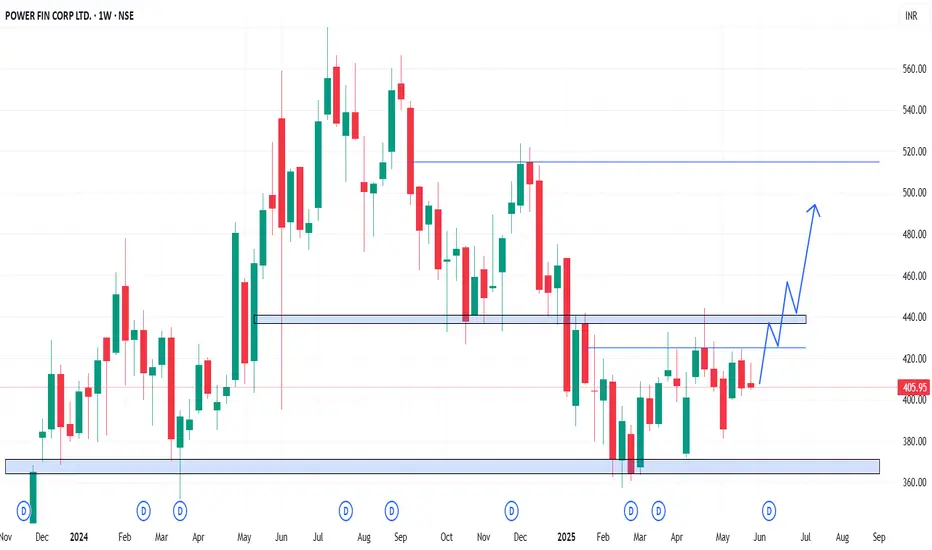
In the Weekly Chart of PFC ,
we can see that; 420-425 levels has shown strong rejection but selling has not been strong as per rejection.
Above 420 it ill bullish till 520 levels.
Trade as per your and Analysis
Expected momentum is shown in chart.
we can see that; 420-425 levels has shown strong rejection but selling has not been strong as per rejection.
Above 420 it ill bullish till 520 levels.
Trade as per your and Analysis
Expected momentum is shown in chart.
免責事項
これらの情報および投稿は、TradingViewが提供または保証する金融、投資、取引、またはその他の種類のアドバイスや推奨を意図したものではなく、またそのようなものでもありません。詳しくは利用規約をご覧ください。
免責事項
これらの情報および投稿は、TradingViewが提供または保証する金融、投資、取引、またはその他の種類のアドバイスや推奨を意図したものではなく、またそのようなものでもありません。詳しくは利用規約をご覧ください。