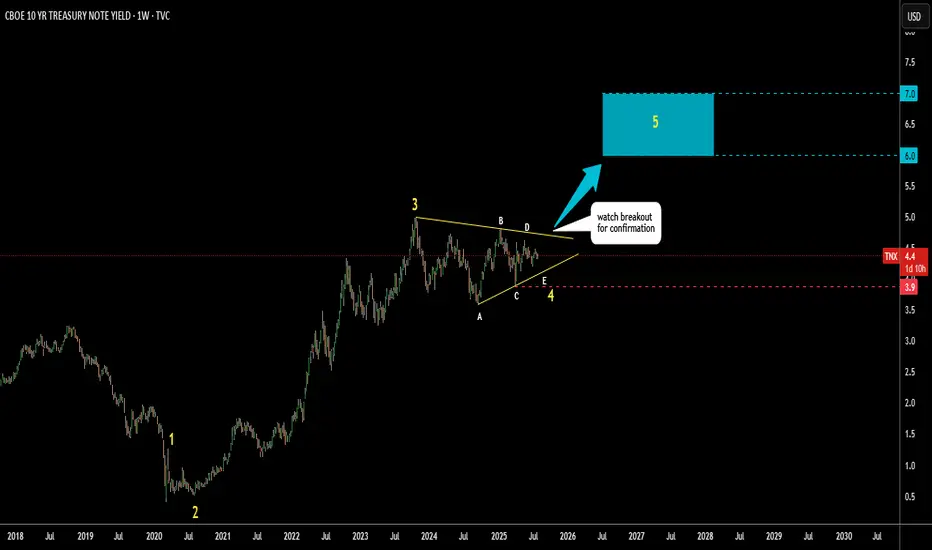
I’ve spotted a well-known triangular pattern forming on the US 10-year Treasury yield.
This appears to be the development of a large Wave 4.
Wave E of Wave 4 may still be unfolding.
Watch to see if it holds above the Wave C low at 3.9%.
A breakout above resistance near 4.7% would confirm the pattern.
The target zone is set between the 38.2% and 61.8% retracement levels of Waves 1 to 3,
highlighted with a blue box between 6% and 7%.
Could tariffs cause a major spike in yields—or will something else trigger it?
Share your thoughts in the comments below.
免責事項
これらの情報および投稿は、TradingViewが提供または保証する金融、投資、取引、またはその他の種類のアドバイスや推奨を意図したものではなく、またそのようなものでもありません。詳しくは利用規約をご覧ください。
免責事項
これらの情報および投稿は、TradingViewが提供または保証する金融、投資、取引、またはその他の種類のアドバイスや推奨を意図したものではなく、またそのようなものでもありません。詳しくは利用規約をご覧ください。