These are two daily timeframe charts of Wipro .
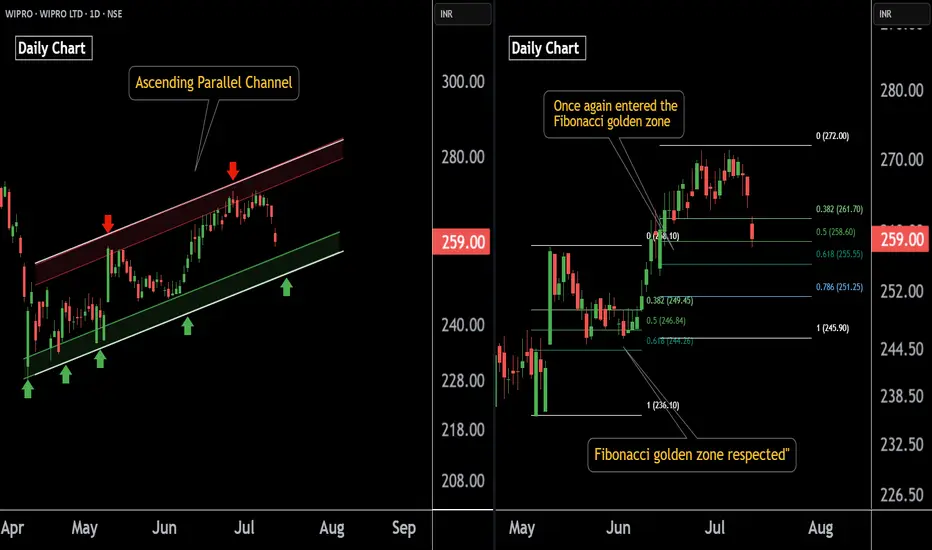
In the first chart : Wipro is trading within an ascending parallel channel, with the lower boundary positioned around the ₹251–₹254 zone.
Wipro has previously respected the Fibonacci golden zone, and the stock is once again approaching this key retracement area. A potential bounce from this zone is likely if the level is respected again around 254 near .
If this level is sustain , then we may see higher Prices in Wipro.
Thank You !!
@RahulSaraoge
Connect us at t.me/stridesadvisory
Connect us at t.me/stridesadvisory
免責事項
これらの情報および投稿は、TradingViewが提供または保証する金融、投資、取引、またはその他の種類のアドバイスや推奨を意図したものではなく、またそのようなものでもありません。詳しくは利用規約をご覧ください。
@RahulSaraoge
Connect us at t.me/stridesadvisory
Connect us at t.me/stridesadvisory
免責事項
これらの情報および投稿は、TradingViewが提供または保証する金融、投資、取引、またはその他の種類のアドバイスや推奨を意図したものではなく、またそのようなものでもありません。詳しくは利用規約をご覧ください。