PROTECTED SOURCE SCRIPT
Amt TDI S2 Pattern
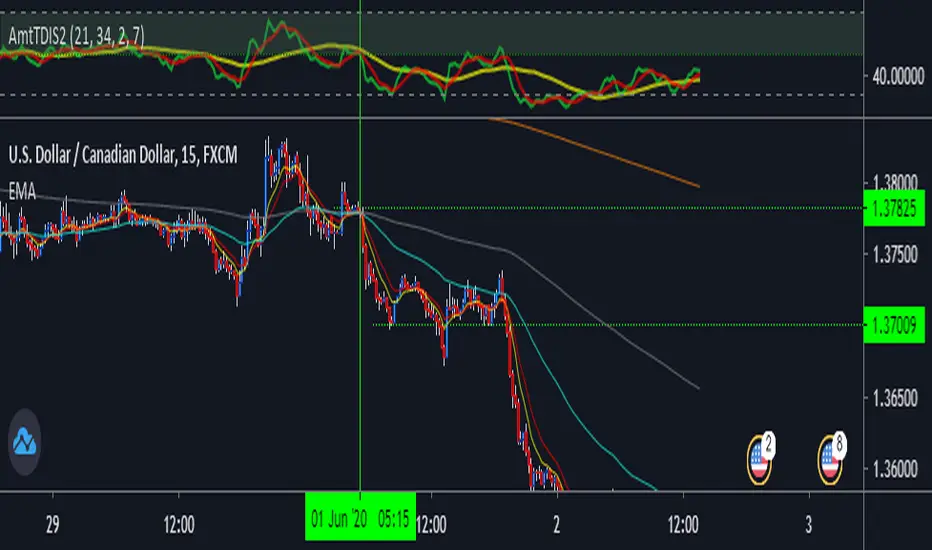
Yellow line-Liquid 50
Green Line-RSI
Red Line-Trend line
You can use it best on 15 min & 5min chart specially for intraday.
Buy Conditions-
: When yellow line is above green zone or 50.
:Green & Red line should cross or above yellow line. Green line should be above redline.
Sell Conditions-
: When yellow line is below green zone or 50.
:Green & Red line should cross or below yellow line. Green line should be below redline.
For better accuracy use it with EMA's.
NOTE- Dont use this strategy when market is sideways or very much volatile.
保護スクリプト
このスクリプトのソースコードは非公開で投稿されています。 ただし、制限なく自由に使用できます – 詳細はこちらでご確認ください。
免責事項
この情報および投稿は、TradingViewが提供または推奨する金融、投資、トレード、その他のアドバイスや推奨を意図するものではなく、それらを構成するものでもありません。詳細は利用規約をご覧ください。
保護スクリプト
このスクリプトのソースコードは非公開で投稿されています。 ただし、制限なく自由に使用できます – 詳細はこちらでご確認ください。
免責事項
この情報および投稿は、TradingViewが提供または推奨する金融、投資、トレード、その他のアドバイスや推奨を意図するものではなく、それらを構成するものでもありません。詳細は利用規約をご覧ください。