OPEN-SOURCE SCRIPT
My Watchlist
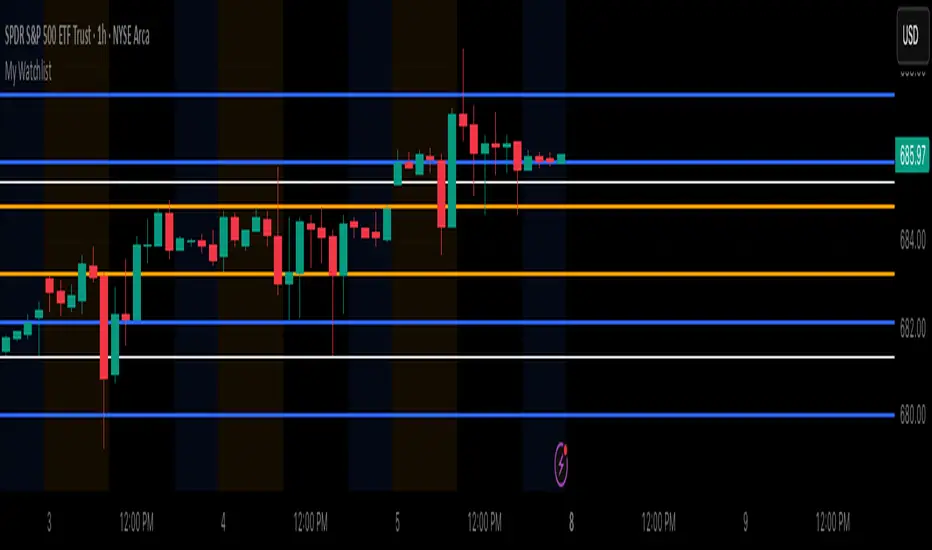
Use Case
Do you belong to a group of traders that post key levels based on their technical analysis to be utilized for trading opportunities? The goal of this indicator is to reduce your daily prep time by allowing you to paste in the actual level values instead of trying to manually create each of the horizontal lines.
How it works
Simply enter the values of the key levels for the tickers that you would like to plot horizontal lines for. If you don't want to plot a level just leave the value as zero and it will be ignored.
Settings
You can enable/disable any of the levels
You can change the colors of the levels
You can add Previous Day High and Previous Day Low levels to the chart
オープンソーススクリプト
TradingViewの精神に則り、このスクリプトの作者はコードをオープンソースとして公開してくれました。トレーダーが内容を確認・検証できるようにという配慮です。作者に拍手を送りましょう!無料で利用できますが、コードの再公開はハウスルールに従う必要があります。
免責事項
この情報および投稿は、TradingViewが提供または推奨する金融、投資、トレード、その他のアドバイスや推奨を意図するものではなく、それらを構成するものでもありません。詳細は利用規約をご覧ください。
オープンソーススクリプト
TradingViewの精神に則り、このスクリプトの作者はコードをオープンソースとして公開してくれました。トレーダーが内容を確認・検証できるようにという配慮です。作者に拍手を送りましょう!無料で利用できますが、コードの再公開はハウスルールに従う必要があります。
免責事項
この情報および投稿は、TradingViewが提供または推奨する金融、投資、トレード、その他のアドバイスや推奨を意図するものではなく、それらを構成するものでもありません。詳細は利用規約をご覧ください。