INVITE-ONLY SCRIPT
Delta Bars [Elykia]
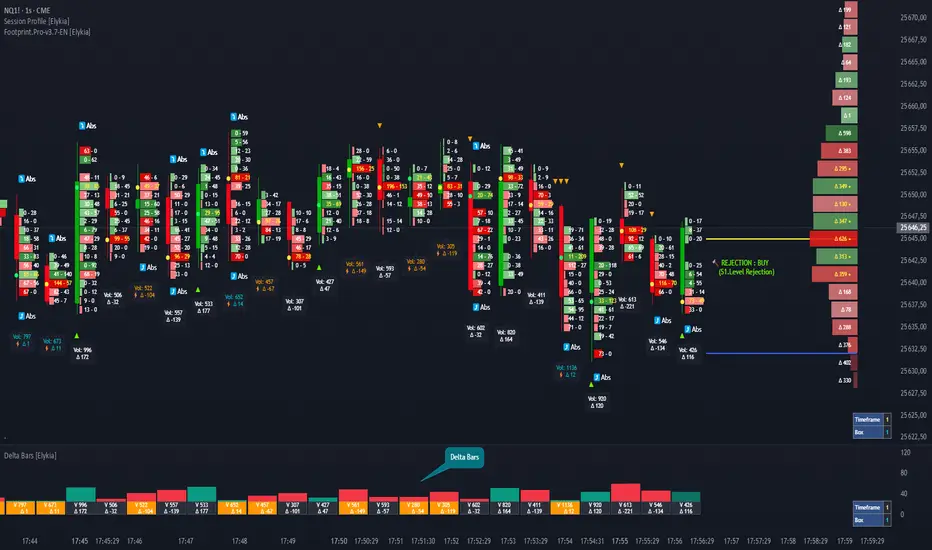
Delta Bars [Elykia] — Order Flow & Momentum Analysis
Description:
Delta Bars [Elykia] is an "Order Flow Oscillator" designed to instantly visualize buyer and seller aggression within every price move.
Unlike standard volume, it breaks down what is happening "under the hood" (Delta) and offers a clear reading of market reversals thanks to intelligent divergence detection.
🔥 Key Features:
1. Dual Calculation Mode:
2. 🧠 Smart Auto-Detection (Plug & Play):
No need to manually calculate "Box" or "Tick" sizes for each asset. The indicator automatically recognizes the asset you are trading and applies the optimal institutional calibration:
3. "Flip" Detection (Divergences) ⚡:
The indicator automatically identifies anomalies between price and Delta:
4. Technical Dashboard:
A discreet panel displays the current mode and "Box" size (in ticks/points) in real-time, ensuring you always know how the data is being filtered.
How to read the signals?
1. Green/Red Bars: They indicate Net Delta (the difference between buying and selling volume). A tall bar implies strong conviction.
2. The ⚡ Symbol (The Flip): This is the most critical signal. It appears when Delta contradicts the candle direction (e.g., Positive Delta on a Bearish candle). This indicates Absorption (passive orders blocking the move) and often precedes a reversal.
3. Range Bars Mode: Use this mode to "smooth out" the market. If the market is choppy, Range Bars will filter the noise and only draw a new bar if the price actually moves.
⚠️ Important: Replay Mode
Since this indicator performs heavy calculations (simulated tick-by-tick), it includes a safety feature for Replay Mode.
Configuration:
Description:
Delta Bars [Elykia] is an "Order Flow Oscillator" designed to instantly visualize buyer and seller aggression within every price move.
Unlike standard volume, it breaks down what is happening "under the hood" (Delta) and offers a clear reading of market reversals thanks to intelligent divergence detection.
🔥 Key Features:
1. Dual Calculation Mode:
- Timeframe Mode: Displays classic Delta based on time (e.g., 1min, 5min).
- Range Bars Mode: (Exclusive) Builds Delta bars based on price movement (volatility) rather than time. This filters out noise during consolidation periods and reveals true strength during impulses.
2. 🧠 Smart Auto-Detection (Plug & Play):
No need to manually calculate "Box" or "Tick" sizes for each asset. The indicator automatically recognizes the asset you are trading and applies the optimal institutional calibration:
- US Indices (NQ, ES, YM...)
- Forex (EURUSD, JPY...)
- Crypto (BTC, ETH)
- Commodities (Gold, Oil)
- Note: You can still switch to manual mode if needed.
3. "Flip" Detection (Divergences) ⚡:
The indicator automatically identifies anomalies between price and Delta:
- If the candle closes Green but Delta is Negative (Absorption/Failed Selling Effort).
- If the candle closes Red but Delta is Positive.
- These situations are marked with a ⚡ symbol and a specific highlight color (Orange by default), often signaling an imminent reversal.
4. Technical Dashboard:
A discreet panel displays the current mode and "Box" size (in ticks/points) in real-time, ensuring you always know how the data is being filtered.
How to read the signals?
1. Green/Red Bars: They indicate Net Delta (the difference between buying and selling volume). A tall bar implies strong conviction.
2. The ⚡ Symbol (The Flip): This is the most critical signal. It appears when Delta contradicts the candle direction (e.g., Positive Delta on a Bearish candle). This indicates Absorption (passive orders blocking the move) and often precedes a reversal.
3. Range Bars Mode: Use this mode to "smooth out" the market. If the market is choppy, Range Bars will filter the noise and only draw a new bar if the price actually moves.
⚠️ Important: Replay Mode
Since this indicator performs heavy calculations (simulated tick-by-tick), it includes a safety feature for Replay Mode.
- To use Replay: Go to settings and set the "Force Replay Date" to a date close to your starting point. This ensures maximum fluidity and avoids TradingView limit errors.
Configuration:
- Works on all timeframes but excels on seconds charts (1s, 5s) or fast minute charts (1m) for scalping.
招待専用スクリプト
このスクリプトは作者が承認したユーザーのみアクセス可能です。使用するにはアクセス申請をして許可を得る必要があります。通常は支払い後に承認されます。詳細は下記の作者の指示に従うか、Elykia34に直接お問い合わせください。
TradingViewは、作者を完全に信頼し、スクリプトの動作を理解していない限り、有料スクリプトの購入・使用を推奨しません。コミュニティスクリプトには無料のオープンソースの代替が多数あります。
作者の指示
Trading (Futures, Crypto, Forex) involves a high level of risk. This indicator is a decision-support and technical analysis tool, not investment advice. The author cannot be held responsible for any losses incurred.
免責事項
この情報および投稿は、TradingViewが提供または推奨する金融、投資、トレード、その他のアドバイスや推奨を意図するものではなく、それらを構成するものでもありません。詳細は利用規約をご覧ください。