Hi This is a small script that tries to assess the probability that a limit order sent at x % from the last close will be filled in the next y bars. It is based on historical data and can be useful to decide where to place your limit orders and to determine how far from the price you can put the limit order to get an X% chance of getting filled. It displays this...
This is effectively version 2 of my script "Candle Fill % Meter", with a few different/more options available in a more compact form. Choose between multiple oscillator sources, # of dividing lines, and solid or gradient candle fill. Once again this script is intended for use with hollow candles! This script enables you to see more information with less screen...
Hello, guys This indicater displays the previous value of higher timeframe without request.security() function. You can change the candle style ( heikinashi or normal) on the set box. you can choose the higher timeframe also. I made this to avoid the repainting. Without Box() function, i only used plotcandle and fill. It was good fun. Good luck !!
this indicator serves to differentiate the classic type Line and source of Alligator There are the classic inputs for the 3 lines ( Jaw , Teeth and Lips ) in addition to the choice of the normal source and the type of line, the choices are: SMA = Simple moving average EMA = Exponential moving average WMA = Weighted moving average RMA = ...
For use with Hollow Candles Fills Candles based on either the value of the RSI or coppock scaled to fit properly between the open and close. Makes for a compact visual with lot's of information given. Toggle bells and whistles in settings such as arrows to indicate the direction of the value being measured, dividing levels, fill from candle open all the time...
This script showcases the new (overload) feature regarding the fill() function! 🥳 2 plots could be filled before, but with just 1 colour per bar, now the colour can be a gradient type. In this example we have 2 plots - rsiPlot , which plots the rsi value - centerPlot, which plots the value 50 ('centre line') Explanation of colour fill in the zone 50-80...
This script showcases the latest feature of colour fill between lines with gradient There are 17 ema's, all with adjustable lengths. In the settings there are 3 options: '1' , '2' , and '1 & 2' : Option '1' Here the highest - lowest lines are filled with a gradient colour, dependable where the 3rd highest/lowest ema is situated in regard of these 2...
This user-friendly indicator allows up to 8 moving averages ( EMA or SMA ) from any timeframe, on any time frame. There are plenty of other MTF MA indicators, each with their own pros and cons. I wanted to make one without the cons: - Independently set each MA to Exponential or Simple - No preset lengths - No preset timeframes - Optional labels to help keep...
Like the nature, markets don't like the void, and this is something we can take advantage of by trading gaps on some markets. This technique is well known, so I wanted to write a tiny script based on this strategy to get a bit more comfortable with it. IMPORTANT: Default parameters wont give you good trades on every markets, you need to modify these parameters...
This script plots two moving averages but is mostly designed to highlight a fill strength gradient. The fill strength gradient shows a more opaque fill based on the current percentage difference of the current difference to the maximum difference in two MAs in a trend. Citation: PinceCoders - Slight modification on color functions
Hi everyone I didn't publish on Friday because I was working on an Expert Advisor in MT4. The day I don't publish, some scripts spamming guys published many (not useful) scripts the same to kick me out of the TOP #1 ranking. So what I'm going to do about it? crying or sharing more quality scripts than before? :) I guess you know the answer :) I'm gonna share a...
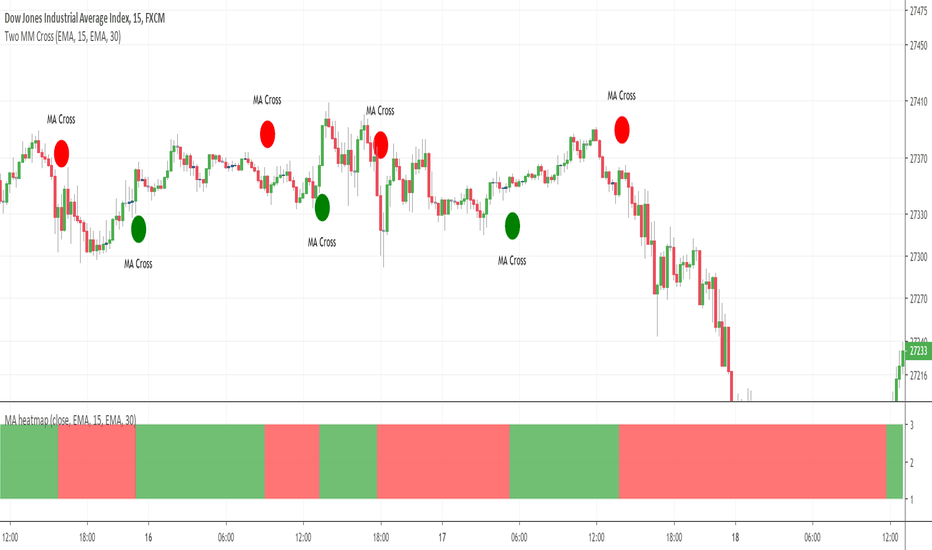
Hello my friends Sorry yesterday I couldn't post an indicator because I was travelling. So here's the today indicator inspired from that one Moving-Average-Heatmap-Visualization/ This will gives an interesting representation of a Double Moving Average cross That's all for me Let's resume the free indicators publishing next Monday with the MA heatmap (Triple...
Moving Average Shaded Fill Area Crossover EMA Color with option to change EMA value


![SUPER Alligator[Gabbo] BTCUSDT: SUPER Alligator[Gabbo]](https://s3.tradingview.com/s/S0Ttroab_mid.png)


![Fill Strength Gradient [BigBitsIO] LTCUSD: Fill Strength Gradient [BigBitsIO]](https://s3.tradingview.com/2/2MgiSgk7_mid.png)


