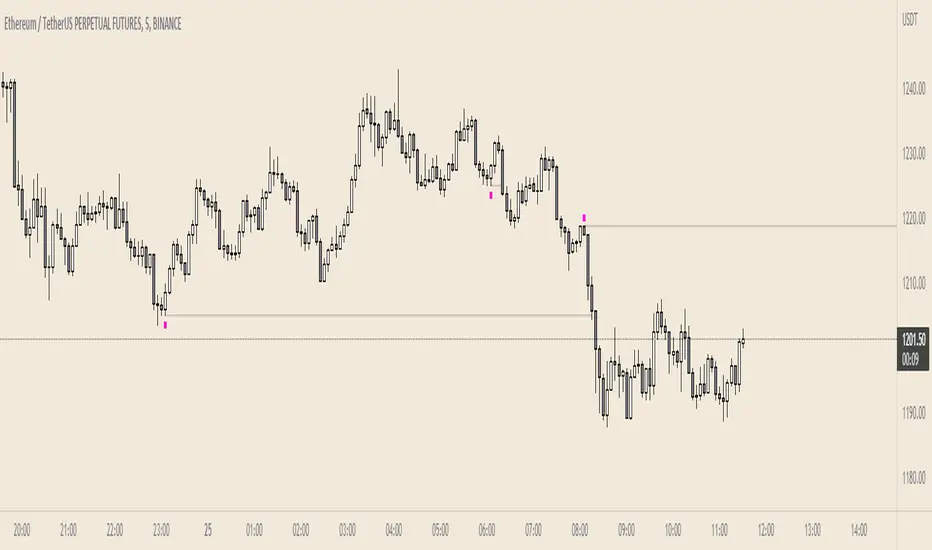
MidWeekPlotMid week high and low Plotting , usefull for finding a mid range or Expiry range detail of High and low インジケーターshas_delhiの投稿アップデート済 97
Failed AuctionAs we know, buyers and sellers take part in the market auction. A failed auction is where price could not tick above or below a specific price. This means that there were no buyers willing to buy or sellers willing to sell beyond that price. Price then moves away in the other direction. The failed auction acts as a magnet and becomes a target to revisit sooner or later. The failed auction is a successful/finished auction once it has been satisfied. On the indicator, two adjacent candles witインジケーターgeneclashの投稿アップデート済 27 1.1 K
MTF Market Structure Highs and LowsThe indicator marks the last fractal highs and lows (W,D,4H and 1H options) to help determine current market structure. The script was created to help with directional bias but also as a MTF visual aid for stop hunts/liquidity raids. Liquidity areas are where we assume trader's stop losses would be when buying or selling. Liquidity lies above and below swing points and institutions need liquidity to fill large orders. Monitor price action as it hits these areas for a potential reversal trade.インジケーターgeneclashの投稿アップデート済 52 3.1 K
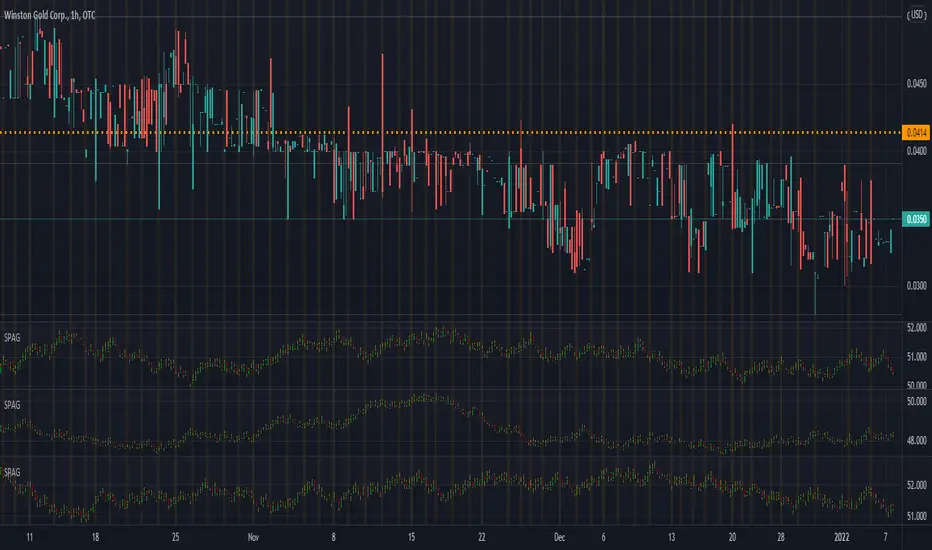
Synthetic Price Action GeneratorNOTICE: First thing you need to know, it "DOES NOT" reflect the price of the ticker you will load it on. THIS IS NOT AN INDICATOR FOR TRADING! It's a developer tool solely generating random values that look exactly like the fractals we observe every single day. This script's generated candles are as fake as the never ending garbage news cycles we are often force fed and expected to believe by using carefully scripted narratives peddled as hypnotic truth to psychologically and emotionally influenインジケーターImmortalFreedomの投稿アップデート済 18301
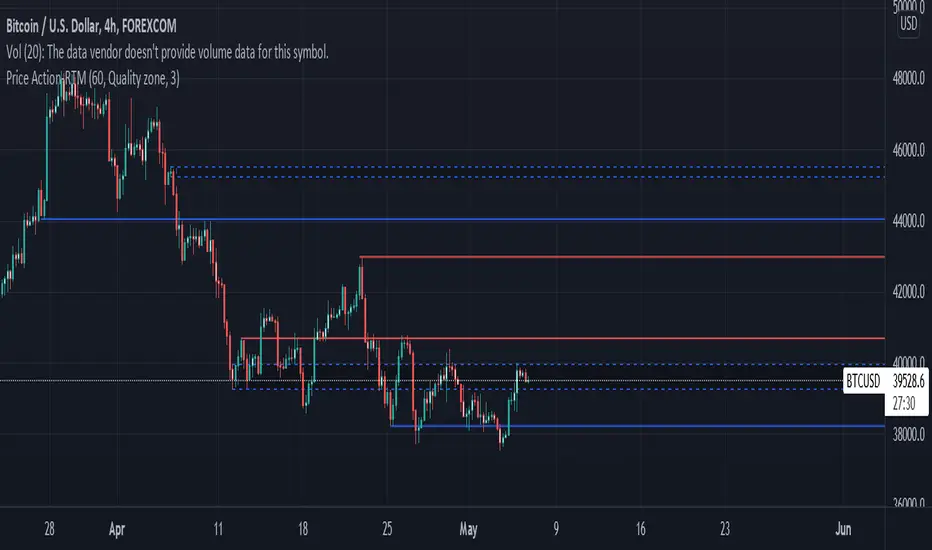
Price ActionFirst, you have to know price action, RTM price action Handbook could help you this indicator shows you base and momentum candles base candles could be zones of trade that show you fighting of bulls and bears, and momentum candles could show the power of those zones. Base candles are white in the chart, and you can place your order at the good zone. Rally candles and drop candles are momentum candles, and bold rally and bold drop show that it is more powerful than its beforインジケーターerfan_abediの投稿アップデート済 65 4.3 K
Relative VolatilityRelative volatility highlights large changes in price. This was designed to be used with my relative volume indicator so that traders can see the effect of volume on price action. It is also a good tool to analyse breakout patterns to identify best entry points and waves. Above shows relative volatility and relative volume working together. インジケーターveryfidの投稿アップデート済 8 1.2 K
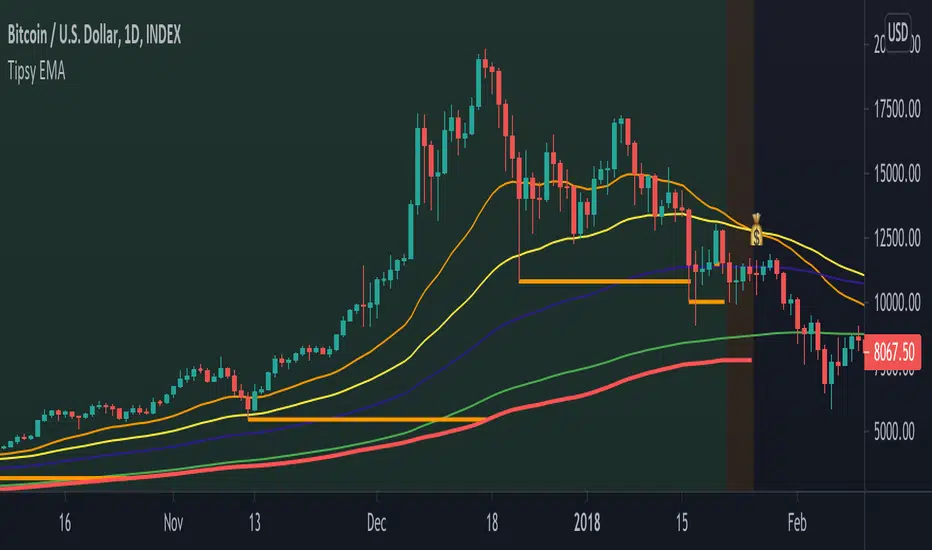
Tipsy EMA Tipsy EMA v0.2a Coded by vaidab. A simple strategy to buy dips in an uptrend. How to use: - buy on trend when price retraces to the orange "buy" line and compound orders - sell when price reaches red line (stop loss) or at 💰 (take profit) Note that you can reverse trade on the 💰 sign for a short scalp / day trade. Uptrend: green/red background. Danger zone: orange bg. No go zone: no bg. Potential buys (in a clear trend): 55, 100, 200 EMA touches and fibo retracemeインジケーターvaidabの投稿2179
First Week Trend [MX]I created this indicator based on one of my ways of analyzing the BTC trend in particular, I noticed that the break of the first weekly candle usually indicates the trend for the rest of the month. This indicator has a bug in which if you change the timeframe of the indicator it will show erroneous values If you use the candlestick chart, you will need to pull the visual order of this indicator to the top to overlay the colors of the standard candles, or simply hide the standard candles the tインジケーターMarqxの投稿アップデート済 3156
Market EmotionsThis is a simple and fun indicator I built out of boredom one night. It's great for a quick laugh, but other than that, it's useless. It simply displays emotes for various thresholds of change in price between the open and close of a candle. For example, unicorn candles are any candles that gain 25% or more from opening price to closing price. インジケーターtacosontitanの投稿10428
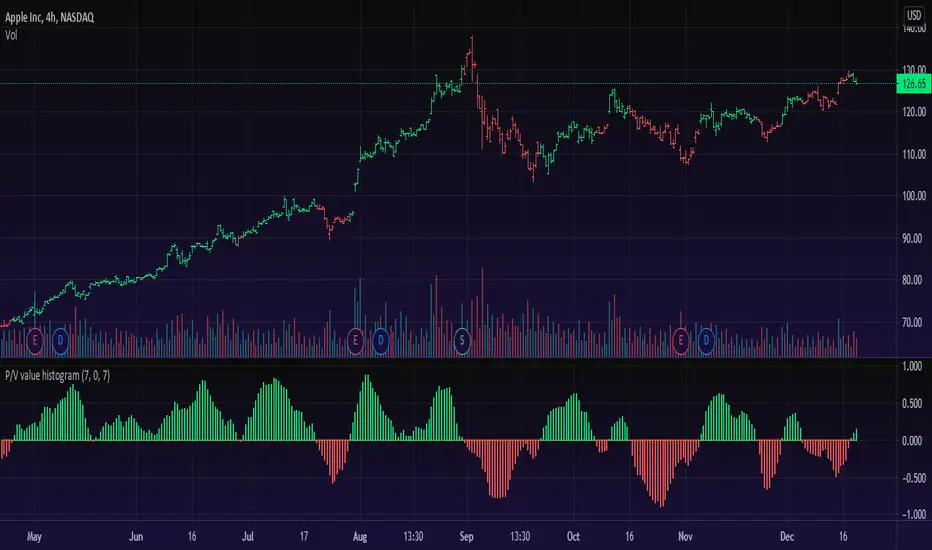
Price/Volume Value HistogramAn interesting implementation of mine to measure an asset changes based on asset price velocity and volume velocity. The indicator acts as asset value calculator. Long and Short. ==Points System Rules== UPTRENDING If Current Close is higher than previous Close and Current Volume is bigger than previous Volume: Adds Close Points and Volume Points Otherwise check If Current Close is higher than previous Close: Adds Only Close Points DOWNTRENDING If Current Close is lower than previous Close andインジケーターdman103の投稿アップデート済 23 1.8 K
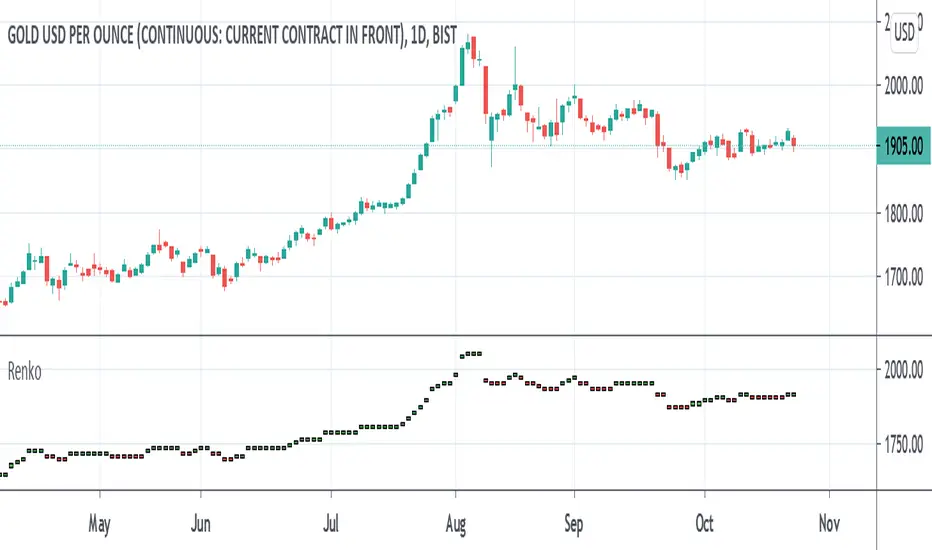
Renko MTF - Traditional and ATRSomehow there aren't too many renko bars that have the traditional setting built-in so I put one up. This one has the option to choose between Traditional and ATR, the size number corresponds to the option that was chosen. And just in case if anyone wanted, I put up a multi-time frame option to choose the time frame the bars take place. D is for day, W is for week, flat numbers are in minutes, and leaving it blank looks at the current time frame the chart is in. The calculation comes from how TrインジケーターSparkyFlaryの投稿アップデート済 19295
ATR TRex [ipooya]To appreciate dear Mr.Khakestar efforts I have converted his mt4 ATR formula to pine script. All credits go to him. you can view the ATR result of each candle in the past: The first black number is the ATR of the M1 chart. The second black number is the ATR of the M5chart. The third black number is the ATR of the M15 chart. The fourth black number is the ATR of the H1 chart. The fifth black number is the ATR of the H4 chart. The sixth black number is the ATR of the Daily chart. The seventh blacインジケーターipooyaの投稿アップデート済 10139
Backwards price projection - few bars ahead reverse chartEver wondered what the chart would look like if it's flipped upside down and flipped horizontally into the future? The idea is that when there is a trend, a repeating pattern tends to occur. Going backwards and projecting that movement into the future can supposedly show what the future price will be. Somehow I haven't found anyone try it like this and I am currently trying to find a way to use a reversed moving average or plot of some kind to project further ahead. TV at the moment does not alインジケーターSparkyFlaryの投稿アップデート済 32471
Moving Average of Upper and Lower Wicks with optional smoothingIn the book, The New Technical Trader by Tushar Chande and Stanley Kroll there is a part that talks about candlestick analysis and how the wicks play a role on how the price will behave. When wick lengths increase then there could be uncertainty. Weakening of support and resistance levels can also be seen by the size of the candlestick wicks or shadows. Shoutouts to Mango2Juice from Tradingview and the The Academy of Forex for helping me out in making this and providing the moving averages functインジケーターSparkyFlaryの投稿アップデート済 3114
Earthquake Effect by DGTInstitutional investors have a profound impact on financial instruments prices because of the large volume, and their trading activities can greatly impact the price of financial instruments. They sometimes may split trades over time in order to not make a material impact and of course not to decrease liquidity to the point where there may be no one to take the other side of the trade. Institutional investors (Smart Money) may create an Elephant Effect on the prices of financial instruments, aインジケーターdgtrdの投稿アップデート済 4857
Strategy based on the principles of Price ActionIt is considered the percentage of candles with low and high closure for a certain period. Then, a moving average is built from these values. When the moving average of the ratio of tall candles to low candles is greater than the ratio of low candles to high, then long (that is, when the green line crosses the red). And vice versa - a condition for short. It also works on crypto with other settings. Idea for improvement: you can make partial exit by taking, at certain profit levels, the chart wiストラテジーUnknownUnicorn3282100の投稿2582
Forecast Oscillator & Point of ForceThis is a scaled version of the Forecast Oscillator, paired with a Point of Force Indicator, my modification of an indicator, whose original name and developer happened to be missing on my notes, so my regards to the author). Point of force is a spot from where price action will dynamically evolve in the same direction or soon reverse and pursue that reversed path. It may be an indication of a turning point or entry point to consider going long/short and should be use together with a background インジケーターcapissimoの投稿3242
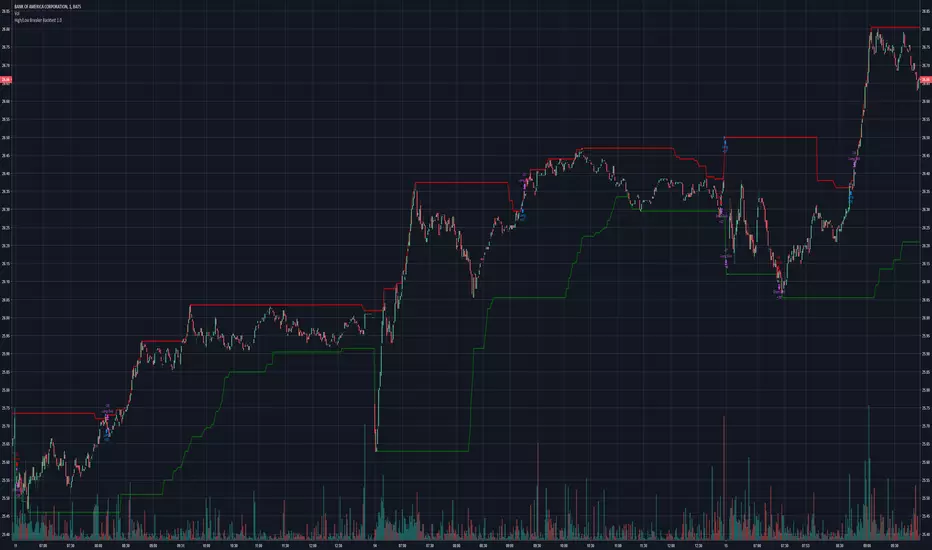
High/Low Breaker Backtest 1.0Play with backtesting results from high/low breaker indicatorストラテジーcsreyes92の投稿62
High/Low Breaker v2Specify Candles back to determine if high/low has been broken. Can choose to either calculate with source of high/low or close.インジケーターcsreyes92の投稿52
Volatility IndicatorThe Volatility Index measures the market volatility by plotting a smoothed average of the True Range. Based on HPotter's idea (), it returns an average of the TrueRange over a specific number of bars. Here the result is passed through the Fisher's transform and normalized to 0/1-range. This indicator may be used to identify stretches in the price movements, suitable for entry.インジケーターcapissimoの投稿86
52 Week High/Low52 Week High / Low Indicator A simple, unobtrusive indicator that can be used on any timeframe to display the 52 week high/low values. Features Works on any timeframe. Unobtrusive: Simple horizontal lines showing only the current 52 week values. Allows the user to select whether to calculate the 52-week values from candle close values or the respective highs/lows. For full overview and code commentary - Visit the backtest-rookies website. インジケーターBacktestRookiesの投稿10 1.5 K