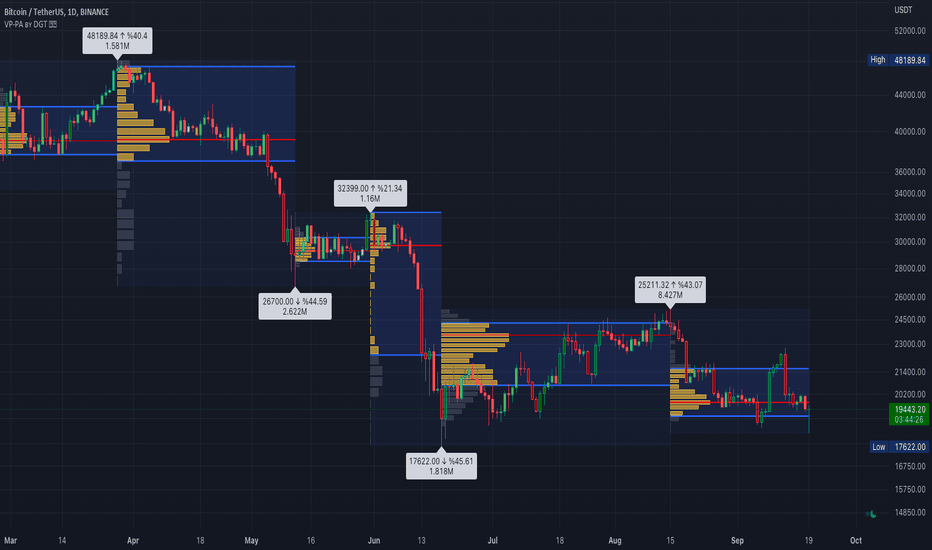
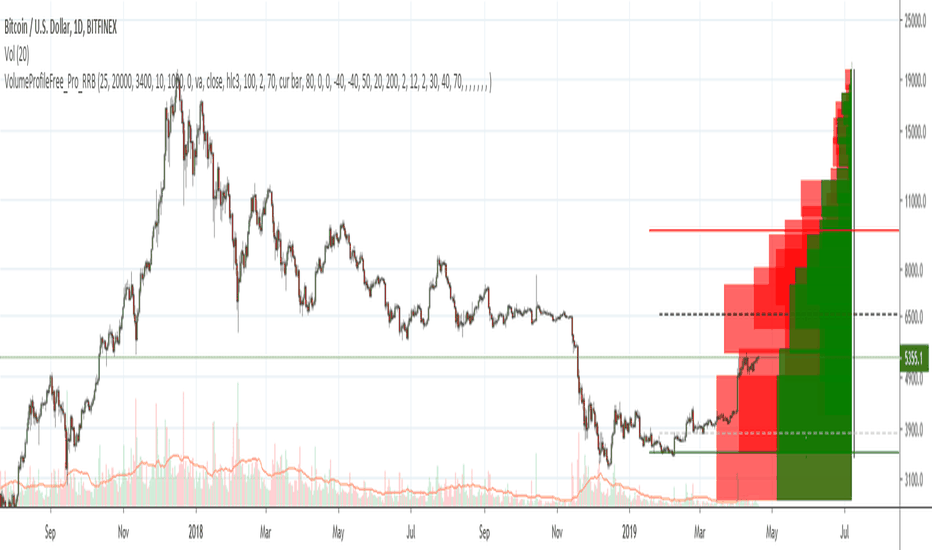
Prev Day/Week/Month/ON VP LevelsBased on Prev Day/Week VP Levels MADE BY ADAM by adam4530. Credit to the original author for the core session-reset and volume-profile calculation approach this script builds on. This script is only tested on Tradingview Premium subscription.
This indicator automatically plots the previous day's, week's, month's, and overnight session's volume profile levels — Point of Control (POC), Value Area High (VAH), and Value Area Low (VAL) — as clean horizontal levels, replicating the look of manually drawn key levels.
What's new vs. the original
Previous Month profile, calculated on its own configurable timeframe (default 5m), kept separate from the Day/Week/ON timeframe so a full month of bars doesn't hit intrabar data limits.
Previous Overnight (ON) profile — a configurable time-of-day session (default 18:00–09:30 New York) rather than a calendar-day session. It rolls over automatically the moment the session ends, replacing the prior ON levels.
Independent styling per period — Day, Week, Month, and ON each get their own line color, width, and style, instead of one shared style for everything.
Extend-to-latest-bar option — lines can stop at the current bar instead of running off the chart indefinitely, for a cleaner look (this is now the default).
How it works
Sessions are defined by a custom reset hour in a chosen timezone rather than midnight exchange time (default 18:00 New York). Weeks run from the Sunday-evening session open through the Friday close; months follow the same reset-hour boundary. The Overnight session instead uses a fixed time-of-day window (default 18:00–09:30) that wraps across midnight, finalizing into "previous ON" levels the moment RTH begins.
All profiles are calculated on a separate, configurable calculation timeframe — 1-minute by default for Day/Week/ON, 5-minute by default for Month — through request.security, independent of the chart timeframe. This means the levels are identical on every chart resolution and remain visible even on a 1-minute chart. Each period's profile distributes bar volume across price rows (default 1000), locates the POC as the highest-volume row, and expands the value area around it until it contains the configured share of total volume (default 70%).
Once a period completes, its levels are drawn and stay fixed until the next rollover — the exact levels a trader would mark by hand at the start of each session.
Features
Previous Day, Week, Month, and Overnight POC/VAH/VAL, each independently toggleable
Custom session reset hour and timezone (DST-safe)
Configurable ON session start/end time
Separate calculation timeframe for Day/Week/ON vs. Month, row count, and value area %
Independent line color, width, and style per period
Choice of extending levels infinitely right or only to the latest bar
Plain text labels with adjustable offset and size
No repainting — only completed periods are plotted
Intended use
Built for intraday traders who anchor execution around prior-session value: value area rotations, POC retests, acceptance/rejection outside prior value, and confluence with order flow, overnight range, or options-derived levels. インジケーター

VWAP Suite [vault]VWAP Suite
Most traders treat VWAP like a single line. This tool treats it the way Auction Market Theory treats it: as a developing value area with a center, an upper edge and a lower edge, tracked across every timeframe that matters, with the previous period frozen next to the current one so you always know where price sits relative to value.
Everything is inside one indicator. Session VWAPs from daily to yearly, standard deviation bands that form the value area, previous period levels, right side labels for every higher timeframe level, and rolling VWAPs over 7, 30, 90 and 365 days.
WHAT IT PLOTS
1. Session VWAPs (Daily, Weekly, Monthly, Quarterly, Yearly)
Each period has its own anchored VWAP that resets at the start of the period. The reset follows the exchange session of the symbol, not midnight UTC, so on CME futures a new daily VWAP starts at 18:00 New York, on OANDA gold at 17:00 New York, and so on. Weekly, monthly, quarterly and yearly resets follow the same logic.
You can enable any combination of these, each with its own color. By default the VWAP lines are drawn dotted so they do not compete visually with the bands and rolling lines. A "Dotted VWAP Lines" toggle switches them back to solid.
The lines break at the period change instead of drawing a vertical jump to the new starting level, so every session or week or month shows as its own clean block.
2. Standard Deviation Bands (Value Area)
Pick one period under "Anchored to Period" and the indicator draws its standard deviation bands around that VWAP:
- VWAP plus 1 SD = VAH (value area high)
- VWAP minus 1 SD = VAL (value area low)
- optional plus and minus 2 SD outer bands
The area between VAH and VAL is filled. Fill transparency is adjustable and defaults to a very subtle 95 so the band reads as a shadow behind price rather than a colored block.
The deviation is calculated with volume weighting from the same cumulative data as the VWAP itself, so VAH and VAL are the true volume weighted 1 SD edges of the developing value area. Bands also break at the period change.
3. Previous Period Levels
At the start of every new period the indicator freezes the VWAP and standard deviation of the period that just closed. Those frozen values are carried forward as flat lines through the current period:
- previous VWAP
- previous VAH and VAL (plus and minus 1 SD)
- optional previous plus and minus 2 SD
These are the levels that matter most from an Auction Market Theory point of view. Price opening inside the previous value area, above it, or below it tells you what kind of day or week you are likely dealing with. The previous value area can be filled as well, with a separate "Fill Prev Bands" toggle.
Each of the five periods keeps its own frozen values, so the previous weekly VAH is genuinely the VAH of last week, not of the last day.
4. HTF Labels (Weekly, Monthly, Quarterly, Yearly)
This is the part that keeps the chart clean. Instead of plotting eight or ten extra lines you get labels on the right side of the chart for the higher timeframe levels:
- current VWAP, VAH, VAL for each of W, M, Q, Y
- previous VWAP, VAH, VAL for each of W, M, Q, Y
Every single label has its own checkbox, so you can show exactly the ones you use and nothing else. Each period has its own color, and previous period labels are automatically dimmed so you can tell them apart at a glance. Two group switches, "Show Current Labels" and "Show Previous Labels", turn whole sets on and off.
Each label comes with a short horizontal tick line drawn at the price level, so you can see where the level sits even when the line itself is not plotted.
5. Rolling VWAPs (7, 30, 90, 365 day)
Rolling VWAPs do not reset. They always look back a fixed number of days and give you the volume weighted average of that whole window. They are calculated by time, not by bar count, so a 30 day rolling VWAP is the same 30 days whether you are on a 5 minute chart or a 4 hour chart. Each one has its own toggle, color and label.
Note on history: the 365 day line needs roughly a year of bars on your chart. On low timeframes with limited history it will be calculated from the first available bar. It is off by default for that reason.
LABEL CONTROLS
- Label Offset: how many bars to the right of the current bar the labels sit
- Label Size: tiny, small, normal or large
- Label Tick Length: length of the short line drawn in front of each label
- Show Right-Side Labels: one master switch that hides every label on the right in one click. Lines and fills stay. Useful when you want to screenshot a clean chart or when the labels start stacking up during a tight range.
HOW WE USE IT
The core idea is that VWAP is fair value for the period and the 1 SD bands are the edges of value. Price accepted inside the bands is balance. Price outside the bands is either an imbalance that will be faded back to value or the start of a trend that leaves the old value area behind.
A few things to watch for:
- Price opening the day or week outside the previous value area and holding there. That is acceptance away from old value and usually the start of a directional move.
- Price opening outside the previous value area and coming straight back inside. Failed breakout, look for a rotation to the other side of the value area.
- Daily VAH or VAL lining up with a weekly or monthly VWAP or value area edge. Stacked value edges from multiple timeframes are where the strongest reactions happen.
- Rolling 7D and 30D crossing or converging. That is medium term value shifting and it often precedes a larger move on the session timeframes.
The labels on the right are there so you never have to guess which level a line represents or scroll around to find the monthly VWAP.
CALCULATION NOTES
- Source is hlc3 by default and can be changed.
- VWAP is the volume weighted average of the source since the period start. Standard deviation is the volume weighted deviation of the source around that VWAP.
- Session boundaries come from the symbol's own exchange calendar.
- On symbols without volume (some CFDs and spot pairs), the indicator falls back to equal weighting so it still plots a time weighted average and bands rather than nothing.
- No repainting. Every value is computed from closed data and a period's frozen levels never change once the period has ended.
- Written in Pine Script v6.
INPUTS OVERVIEW
General: source, label offset, label size, label tick length, right side labels master switch
Session VWAPs: Daily / Weekly / Monthly / Quarterly / Yearly with colors, line width, dotted or solid
Standard Deviation Bands: on/off, anchored period, fill on/off, 2 SD bands on/off, colors, fill transparency
Previous Period Levels: prev 1 SD levels, prev 2 SD levels, prev labels, fill prev bands, color
HTF Labels: current / previous group switches, then per period color and six individual checkboxes (VWAP, VAH, VAL, pVWAP, pVAH, pVAL)
Rolling VWAPs: 7 / 30 / 90 / 365 day with colors
Works on any market and any timeframe. Built for futures and gold on intraday charts but the logic is the same on crypto, forex and stocks. インジケーター

Liquidity HeatmapLiquidity Heatmap – POC and Value Area.
A rolling volume-density profile rendered directly onto the price chart. Over a configurable lookback window the indicator distributes each historical bar's volume across every price bin its high-low range covered, then draws the resulting distribution as color-graded horizontal lines at each bin's midpoint. Point of Control and Value Area (70 % of total volume) are computed automatically, and a compact right-side histogram mirrors the profile in the future-offset zone. Built for intraday and swing traders who want a live, minimal read of where the market actually did business — the real liquidity anchors, not manual pivots.
How it works:
The indicator recalculates every N bars (default 5). On each recalc it finds the highest and lowest price of the lookback window, splits that range into a configurable number of bins (default 40), and iterates through every bar in the window. For each bar its volume — or a unit weight if volume weighting is disabled — is added to every bin whose price range the bar crossed. The result is a density array: the more time price stayed inside a bin and the higher the volume of those bars, the larger its density value. Bins are drawn as thin horizontal lines at their midpoints, with color and transparency scaled by the ratio of bin density to peak density.
The Point of Control is the bin with the largest total. Value Area is grown outward from POC, alternately taking whichever adjacent side holds more volume, until 70 % of the entire distribution is covered — VAH becomes the upper boundary of that region and VAL the lower. A right-side density histogram in the chart's offset zone re-renders the same profile in bar-chart form, and the level labels (POC / VAH / VAL) sit past the histogram so they never overlap the main heatmap. The information panel in the top-right corner shows the numeric price of each level and its signed percentage delta to the current close, color-coded green when the level sits above price, red when below, gray at parity.
What it calculates:
- Volume density per price bin over the lookback window
- POC — Point of Control, the bin with peak accumulated volume
- VAH — Value Area High, upper boundary of the 70 % volume region
- VAL — Value Area Low, lower boundary of the 70 % volume region
- Signed delta from current close to POC / VAH / VAL, in percent
Key features:
- Rolling recalculation every N bars for tunable CPU / responsiveness balance
- Volume weighting (default) or touch-count mode as a per-price frequency map — useful when volume data is unreliable
- Four-stop plasma color gradient (deep navy → violet → magenta → amber), every stop user-overridable via input.color
- Constant 1-pixel line width across all bins; visual weight is carried entirely by color intensity and transparency
- POC solid line and label placed past the offset histogram for readability
- VAH / VAL dashed lines extended all the way to their labels so the eye follows the level continuously
- Compact right-side density histogram in the future-offset area, mirroring the main profile in bar-chart form
- Top-right information panel with POC / VAH / VAL price and signed percentage delta to the current close, colored by side (green above / red below / gray at parity)
- Independent visibility toggles for POC and Value Area
- Adaptive bin geometry — resolution scales automatically with the price range of the lookback window
- Runs on any timeframe and any instrument; no external data sources required
Who it's for:
Intraday scalpers, swing traders, order-flow and Market Profile practitioners who need to see the true volume anchors of the current regime instead of hand-drawn horizontals. The color-graded strips make dominant liquidity walls, thin gaps and Value Area boundaries visually obvious at a glance, so attention goes to execution rather than to marking up the chart. インジケーター

Visible Range Volume NodesVisible Range Volume Nodes is a visible-range volume profile indicator that shows how traded volume is distributed across price levels inside the currently visible chart area.
The script builds a horizontal volume profile from the candles visible on the chart. It divides the visible price range into rows and distributes each candle's volume across the price rows touched by that candle's high-low range. Rows with more accumulated volume are displayed wider. Rows with less accumulated volume are displayed narrower.
How volume is calculated
Each candle's volume is distributed proportionally across the price rows covered by that candle's high-low range. If a candle covers several rows, its volume is split between those rows based on the amount of price overlap.
Bullish and bearish volume are separated using candle direction:
* Candles closing above their open are counted as bullish volume;
* Candles closing below their open are counted as bearish volume;
* Neutral candles are split evenly.
Key Volume Areas
POC - Point of Control
POC is the price row with the highest volume inside the visible range. It marks the largest volume concentration in the selected chart area.
VAH - Value Area High
VAH is the upper boundary of the value area.
VAL - Value Area Low
VAL is the lower boundary of the value area.
The value area starts from the POC and expands through the highest-volume neighboring rows until the selected percentage of total visible-range volume is included. By default, this is commonly used as a 70% value area, but the percentage can be changed in the settings.
HVN - High Volume Node
HVN zones are high-volume areas detected from local peaks in the smoothed volume profile. These zones show where volume was concentrated compared with nearby price levels.
LVN - Low Volume Node
LVN zones are low-volume areas detected from local valleys in the smoothed volume profile. These zones show where volume was thinner compared with nearby price levels.
How to use it
The profile can help users compare current price action with previously traded volume areas inside the selected visible range:
* POC shows the main high-volume reference area of the visible range;
* VAH and VAL show the upper and lower limits of the main value area;
* HVN zones show areas where price previously spent more volume;
* LVN zones show areas where volume was thinner relative to nearby price levels;
* The histogram shows the full volume distribution across the selected price range.
A trader can use these areas as context when analyzing price location. For example, price trading near POC is trading near the main volume concentration of the visible range. Price trading near VAH or VAL is trading near the edge of the calculated value area. HVN and LVN zones can be used to compare current price behavior with areas of stronger or weaker previous volume participation.
These levels should be treated as structural references only. They are not automatic entries, exits, support, resistance, targets, or invalidation levels.
Main settings
* Profile Rows controls how many price rows are used to build the volume profile. More rows create a more detailed profile. Fewer rows create a smoother, broader profile;
* Value Area % controls how much of the visible-range volume is included inside the value area;
* Histogram Direction controls whether the profile is displayed to the left or right side of the visible chart area;
* Profile Distance controls the spacing between the visible candles and the profile panel;
* The script also includes settings for showing or hiding POC, VAH/VAL, HVN, LVN, labels, prices in labels, line style, line width, label size, and colors.
Limitations
*This indicator does not generate buy or sell signals;
*It does not predict future price direction;
*It does not define guaranteed support or resistance;
*It does not use exact bid/ask volume;
*It does not use footprint, delta, or order book data.
The displayed structure depends on the selected visible range, symbol, exchange, timeframe, and available volume data.
Because the profile is based on the currently visible chart range, moving or zooming the chart can change the calculated POC, value area, HVN zones, and LVN zones.
インジケーター

Auction Intelligence█ AUCTION INTELLIGENCE
Auction Market Theory Overlay
An Auction Market Theory (AMT) overlay that analyzes market structure through volume profile analysis. It detects profile shape (D/P/b/DD), identifies balance vs. imbalance states, and tracks value migration — giving you the same auction-based framework used by institutional traders to understand market behavior.
Free and Open Source.
█ THE CONCEPT: WHY AUCTION MARKET THEORY MATTERS
Standard indicators tell you what happened. AMT tells you why . Markets are continuous two-sided auctions where buyers and sellers negotiate fair value:
Balance — Price rotates within an accepted value area. Expect mean-reversion and range-bound trading.
Imbalance — Price breaks away from the value area. One side dominates. Expect continuation.
Profile Shape — The distribution of volume tells you who is in control and what to expect next.
Value Migration — The direction where the POC and Value Area are shifting reveals the underlying trend.
█ CORE FEATURES
1. Volume Profile Engine
Distributes each bar's volume proportionally across price rows, building a volume-at-price distribution:
POC (Point of Control) — Highest volume row = strongest S/R level
VAH (Value Area High) — Upper boundary of the 70% value area = resistance
VAL (Value Area Low) — Lower boundary of the 70% value area = support
2. Profile Shape Detection
Automatically classifies the volume distribution into four distinct shapes:
D-shape — Balanced. Volume evenly distributed, POC near center. Expect rotation.
P-shape — Bullish. Volume concentrated in upper half. Buyers in control.
b-shape — Bearish. Volume concentrated in lower half. Sellers in control.
DD (Double Distribution) — Two distinct volume clusters. Market transitioning between value areas.
3. Balance vs. Imbalance Recognition
Three-factor analysis combining price position, VA width dynamics, and trend strength. The chart background colors automatically when imbalance is detected (cyan = bullish discovery, red = bearish discovery).
4. Value Migration Tracker
Monitors how the POC and Value Area midpoint shift over time:
Bullish Migration ▲ — POC and VA migrating higher = institutional buying
Bearish Migration ▼ — POC and VA migrating lower = institutional selling
Neutral ─ — No significant migration = consolidation
█ AUTO-TIMEFRAME ADAPTATION
All parameters automatically adjust based on the chart timeframe:
1-5 min → Lookback 30, 18 Rows, Migration Len 5
15-30 min → Lookback 40, 20 Rows, Migration Len 8
1 Hour → Lookback 50, 24 Rows, Migration Len 10
4 Hour → Lookback 70, 28 Rows, Migration Len 15
Daily → Lookback 100, 32 Rows, Migration Len 20
Weekly+ → Lookback 150, 40 Rows, Migration Len 30
Disable Auto-TF to use manual settings for full control.
█ DASHBOARD
A compact, dark-themed info panel displaying:
State — Current AMT state (BALANCE / IMBALANCE) with context
Shape — Detected profile shape (D / P / b / DD) with description
Migration — Value migration direction and strength
Position — Current price position relative to Value Area
POC / VAH / VAL — Key volume-based levels
█ ALERTS (4 CONDITIONS)
Balance → Imbalance — Market leaving the value area
Imbalance → Balance — Market returning to the value area
Profile Shape Changed — Volume distribution pattern shift
Value Migration Shift — Directional bias change in POC/VA migration
█ PRO VERSION
The PRO version (Auction Intelligence PRO v2.0) adds:
Initial Balance Range — IB Tracking + IB Extension Detection
Failed Auction Detection — VA Breakout Failures
Excess & Poor High/Low — Wick analysis at session extremes
Auction Rotation Factor — POC-cross frequency as market efficiency measure
Day Type Classification — Trend/Normal/Normal Var./Neutral/Double Dist. (Dalton)
Previous Day Value Area — PDPOC/PDVAH/PDVAL as reference levels
Enhanced Confluence Score — 0-12 scale with A+ to D grading
13 Alert Conditions
█ NON-REPAINTING
The volume profile is calculated from confirmed bar data only. The rolling lookback window recalculates on each confirmed bar using historical high/low/volume — no future data is used. No repainting.
█ WORKS ON
Crypto, Forex, Stocks, Futures, Indices — any timeframe from 1 minute to Monthly.
█ DISCLAIMER
This indicator is for educational and informational purposes only. It does not constitute financial advice. Always do your own research and manage your risk. Past performance does not guarantee future results. Trading involves substantial risk of loss.
インジケーター

Volume Profile█ VOLUME PROFILE
Volume-at-Price Analysis with POC, VAH & VAL
A powerful volume-at-price analysis overlay that calculates and visualizes the Point of Control (POC) , Value Area High (VAH) , and Value Area Low (VAL) directly on your chart. It reveals where the most trading activity occurred and provides real-time price position analysis — helping you identify high-probability support/resistance levels and mean-reversion zones.
Free and Open Source.
█ THE CONCEPT: WHY VOLUME PROFILE MATTERS
Price charts show when trading happened. Volume Profile shows where it happened. The distribution of volume across price levels reveals the market's true valuation zones:
Point of Control (POC) — The price with the highest accumulated volume. Acts as a magnet for price and the strongest single S/R level.
Value Area (70%) — The range containing 70% of all traded volume. Defines what the market considers "fair value."
Above/Below VA — Price outside the value area signals potential overextension or breakout.
Institutional traders, market makers, and algorithmic systems all reference volume profile levels.
█ CORE FEATURES
1. Volume Profile Engine
Distributes each bar's volume proportionally across the price rows it spans, building a precise volume-at-price histogram:
POC — Highest volume row = strongest support/resistance
VAH — Upper boundary of the 70% value area = resistance
VAL — Lower boundary of the 70% value area = support
Row count is configurable (10-50 levels).
2. Profile Anchoring
Three anchor modes control how the profile is built:
Rolling — Continuously recalculated over the last N bars. Best for real-time analysis.
Session — Resets every new trading day. Best for intraday context.
Week — Resets every new trading week. Best for swing context.
3. Price Position Analysis
Real-time classification of price relative to the value area:
ABOVE VA — Potential overextension or breakout
BELOW VA — Potential undervaluation or breakdown
AT POC — High-probability mean-reversion zone
IN VA — Normal trading range
4. Bounce & Rejection Signals
Automatic detection of price interaction with key volume levels:
POC Bounce Up/Down — Price touches POC and reverses
VAL Rejection — Price tests VAL and bounces up (bullish)
VAH Rejection — Price tests VAH and bounces down (bearish)
5. Volume Histogram Visualization
A horizontal bar chart displayed directly on the price chart showing the volume distribution. POC row highlighted with a distinct color.
█ AUTO-TIMEFRAME ADAPTATION
All parameters automatically adjust based on the chart timeframe:
1-5 min → Lookback 30, 18 Rows, Histogram Width 8
15-30 min → Lookback 40, 20 Rows, Histogram Width 10
1 Hour → Lookback 50, 24 Rows, Histogram Width 15
4 Hour → Lookback 70, 28 Rows, Histogram Width 18
Daily → Lookback 100, 32 Rows, Histogram Width 22
Weekly+ → Lookback 150, 40 Rows, Histogram Width 30
█ DASHBOARD
A compact, dark-themed info panel displaying:
POC — Current Point of Control price level
VAH / VAL — Value Area boundaries
Position — Current price position (ABOVE VA / BELOW VA / AT POC / IN VA)
To POC — Distance from current price to POC in percent
Anchor — Active profile anchor mode
VA Range — Width of the value area in price units
█ ALERTS (4 CONDITIONS)
POC Bounce Up — Bullish bounce off the Point of Control
POC Bounce Down — Bearish bounce off the Point of Control
VAL Rejection — Bullish rejection at Value Area Low
VAH Rejection — Bearish rejection at Value Area High
█ NON-REPAINTING
The volume profile is calculated from confirmed bar data only. Rolling mode recalculates the full lookback window on each bar using historical high/low/volume — no future data is used. Session and Week modes accumulate incrementally within the anchor period. No repainting.
█ WORKS ON
Crypto, Forex, Stocks, Futures, Indices — any timeframe from 1 minute to Monthly.
█ DISCLAIMER
This indicator is for educational and informational purposes only. It does not constitute financial advice. Always do your own research and manage your risk. Past performance does not guarantee future results. Trading involves substantial risk of loss.
インジケーター

AG Pro Volume Profile POC Magnet Map [AGPro Series]AG Pro Volume Profile POC Magnet Map
Overview
AG Pro Volume Profile POC Magnet Map is a chart-overlay indicator built around one practical question: how strongly is the current Point of Control attracting, holding, or losing price?
Instead of trying to replicate a full volume-profile workstation, this script focuses on the behavior of the active POC and the surrounding value area. The goal is to turn a familiar volume-profile concept into a cleaner decision-support map that helps users judge whether price is still interacting with the current fair-value center, rejecting it, reclaiming it, or beginning to establish value elsewhere.
The script is designed for users who want a visual framework around POC behavior without covering the chart with heavy histogram structures or overly complex dashboards. It highlights the active POC, the current Value Area High (VAH), the current Value Area Low (VAL), a compact magnet band around the POC, and a small set of reaction labels that describe how price is interacting with that area.
In short, this indicator is not trying to tell users what to buy or sell. It is trying to make one specific market reference more readable: the relationship between price and the current POC region.
What the script does
At a high level, the script does five things:
1) It builds a fixed-lookback volume-distribution map from recent chart data.
2) It derives the active POC, VAH, and VAL from that distribution.
3) It measures how close price is to the current POC and how often price revisits or accepts that region.
4) It converts those observations into a compact Magnet Score and state readout.
5) It marks a small set of price/POC interaction events such as Tag, Reject, and Reclaim.
The result is a visual tool that combines reference levels and contextual interpretation in one overlay.
Unique edge
Many indicators can show a POC. This script is built to answer a more specific question: what is the quality of the current POC as a magnet for price?
That difference matters. A raw POC line can be useful, but by itself it does not explain whether price is repeatedly returning to it, drifting away from it, rejecting it, or stabilizing around it. This script adds that missing context by combining the active POC with a behavior layer.
The design goal is not “more features.” The design goal is clearer interpretation:
- Is price still accepting the current value center?
- Is the POC functioning as a pullback magnet?
- Is price rejecting the area instead of accepting it?
- Is value beginning to migrate?
That is the role of the score, the state engine, and the reaction labels.
Methodology
The script uses a fixed lookback window and divides the recent price range into user-defined bins. It then allocates each bar’s volume to one price bin using the selected bar source, which can be Close or HLC3. From that distribution it identifies:
- POC: the highest-volume bin in the lookback window
- VAH: the upper boundary of the selected value area percentage
- VAL: the lower boundary of the selected value area percentage
After the levels are derived, the script evaluates how price is behaving relative to the active POC region.
The Magnet Score is built from multiple components:
- Distance: how far current price is from the POC, normalized by ATR
- Revisit behavior: how often price has returned to the POC region
- Acceptance behavior: how often price has closed near the POC region
- Stability: whether the POC is relatively stable or drifting quickly
- Rejection pressure: whether interactions with the POC region are ending in rejection rather than acceptance
These components are combined into a bounded 0-100 score. Higher readings suggest that the current POC remains a stronger center of attraction. Lower readings suggest weaker pull, weaker acceptance, or a market beginning to operate away from the current value center.
The script then classifies context into states such as:
- Magnet Strong
- Magnet Active
- POC Tagged
- POC Rejected
- Accepted Away
- Magnet Weakening
This state layer is designed to summarize the current context rather than generate automatic trading instructions.
How to read the chart
POC
The POC is the main reference line. It marks the highest-volume price zone inside the selected lookback distribution. If price repeatedly returns to it, reacts from it, or consolidates around it, that line is functioning as an active center of interest.
VAH and VAL
VAH and VAL define the current value-area boundaries. These help users judge whether price is still operating inside value or beginning to establish acceptance above or below it.
Magnet band
The magnet band is a narrow region around the POC. It exists to make POC interaction easier to read visually. It is not a claim that every touch is meaningful. It is simply a compact visual tolerance zone around the active POC.
Reaction labels
The script can display a small set of event labels:
- Tag: price reached the current POC region
- Reject: price interacted with the area and moved away
- Reclaim: price crossed back through the active POC after being on the other side
These labels are meant to help describe interaction, not to replace confirmation logic, risk management, or broader market context.
Panel
The panel summarizes:
- Magnet Score
- POC Distance
- POC Drift
- Value Context
- Last Reaction
- Current POC / VAH / VAL values
This gives users a quick status view without needing to inspect every line manually.
Typical use cases
This indicator may be useful when users want to:
- monitor whether pullbacks are still returning to the active POC
- judge whether price is still auctioning inside value or beginning to accept away from value
- compare different symbols for how “sticky” the current POC region appears to be
- add context to an existing structure, trend, or mean-reversion workflow
- keep a cleaner chart while still tracking basic volume-profile behavior
The script is intended as a context and interpretation layer. It is not a complete trading plan on its own.
Key inputs
Lookback Bars
Controls the size of the historical window used for the profile calculation. A larger value creates a broader context. A smaller value makes the profile more reactive.
Rows / Bin Count
Controls profile granularity. Higher values create more detailed binning. Lower values produce a smoother, simpler map.
Value Area %
Defines how much of total lookback volume is included inside the value area used to derive VAH and VAL.
Price Source For Bin Allocation
Lets users choose whether each bar’s volume is allocated using Close or HLC3. This changes how the profile is distributed across bins.
ATR Length
Used in normalization and spacing calculations, including the distance component and label positioning.
Magnet Band Width (ATR)
Controls the thickness of the tolerance zone around the active POC.
Distance Ceiling (ATR)
Caps how far price can be from the POC before the distance component is treated as maximally weak.
Revisit Window and Acceptance Window
These affect how the script measures repeated interaction and acceptance around the active POC region.
POC Drift Lookback
Used to estimate whether the active POC is relatively stable or shifting.
Label controls
Users can adjust label visibility, density, cooldown behavior, and right-edge line labels to keep the chart cleaner or more descriptive depending on preference.
Alerts
The script includes alert conditions for:
- POC Tag
- POC Reject
- POC Reclaim
- Magnet Strong
- Magnet Active
- Magnet Weakening
- Accepted Away
These alerts are event-based notifications tied to the script’s contextual logic. They are not performance claims and they should not be interpreted as guaranteed entry or exit signals.
Limitations and transparency
This script uses a fixed-lookback, bar-based approximation of volume distribution. It does not reconstruct native exchange-level order flow, bid/ask delta, or true tick-by-tick auction detail.
Volume is allocated to bins using a selected bar source rather than full intrabar volume-at-price reconstruction. That means the profile is intentionally simplified so it can remain lightweight and readable inside a standard Pine overlay.
Because the script uses a rolling lookback window, the active POC, VAH, and VAL can change as older bars leave the window and newer bars enter it. That is normal behavior for this design.
The reaction labels are descriptive, not predictive. A Tag does not imply reversal. A Reject does not guarantee continuation. A Reclaim does not guarantee trend resumption. They are context markers showing how price interacted with the current POC area according to the script’s definitions.
This tool should be read in conjunction with price structure, volatility, liquidity conditions, and user-defined execution rules.
What this script is not
This script is not:
- a full session volume-profile suite
- an order-flow or footprint tool
- a prediction engine
- a guaranteed reversal detector
- a stand-alone trade system
It is a focused overlay for interpreting how price is behaving around the current Point of Control and value-area structure.
Practical interpretation notes
In many markets, the POC acts like a reference area rather than a directional signal. The more often price returns to it and the more often price stabilizes near it, the more useful that region can become as a working fair-value reference.
By contrast, when price begins to hold above VAH or below VAL and stops interacting meaningfully with the POC region, the script may shift toward weaker magnet states or accepted-away context. That does not automatically imply trend continuation, but it does suggest that the current value center may be losing influence.
Users may find this especially useful when comparing:
- balanced conditions vs. directional conditions
- shallow pullbacks vs. deeper value retests
- symbols that keep rotating through value vs. symbols that are clearly accepting away from it
Risk disclosure
This indicator is for chart analysis and market context only. It does not provide investment advice, trading advice, or guaranteed outcomes.
All indicators simplify market behavior. This script is no exception. Markets can ignore previously important value references, react differently across symbols and timeframes, and change behavior as volatility regimes shift.
Users are responsible for their own confirmation process, execution decisions, and risk management. インジケーター

Stratum Depth Profile [JOAT]Stratum Depth Profile
Introduction
The Stratum Depth Profile is an open-source volume profile indicator built in Pine Script v6. It calculates and displays a real-time Volume Profile histogram directly on the price chart, identifying the Point of Control (POC), Value Area High (VAH), Value Area Low (VAL), and classifying price zones as High Volume Nodes (HVN) or Low Volume Nodes (LVN). The indicator separates buying and selling volume within each price level, calculates a context score based on where price sits relative to the profile, and detects institutional signals like POC reclaims, Value Area breakouts, absorption events, and delta imbalances.
Unlike simple volume bars beneath the chart, this indicator maps volume across price levels to show where the most trading activity occurred. The POC represents the price level with the highest traded volume — a natural magnet for price. The Value Area contains the configurable percentage (default 70%) of total volume, defining the range where most participants agreed on value. Price outside the Value Area is in a statistical extreme and tends to revert or accelerate.
Why This Indicator Exists
Volume Profile is one of the most powerful tools in institutional trading, but most implementations on TradingView either require paid subscriptions, lack delta separation, or do not provide context scoring. This indicator addresses those gaps:
Full Volume Profile Calculation: Bins volume across configurable price levels over a lookback period, producing a true histogram of volume by price
Bull/Bear Delta Separation: Each price level's volume is split into buying volume (close > open candles) and selling volume (close < open candles), revealing who controls each level
POC / VAH / VAL Detection: Automatically identifies the Point of Control and expands outward to find the Value Area boundaries containing the specified percentage of total volume
Context Scoring: A 0-100 score based on price position relative to the profile (above VAH, at POC, below VAL, etc.) combined with SMA alignment, giving a quick read on the current market context
Institutional Signal Detection: POC Reclaim, POC Rejection, VA Breakout, Absorption, Delta Imbalance, and Zone Shift events with anti-overlap cooldowns
HVN/LVN Classification: Identifies which price levels have concentrated volume (support/resistance) versus thin volume (fast-move zones)
How Volume Profile Calculation Works
The indicator divides the price range of the lookback period into a configurable number of rows (default 24). For each bar within the lookback, it determines which price bin the bar's activity falls into and accumulates volume. The calculation separates bullish and bearish volume:
// For each bar in the lookback, assign volume to the appropriate price bin
// Bullish volume: bars where close > open
// Bearish volume: bars where close < open
// POC = price bin with the highest total volume
// Value Area = expand from POC until cumulative volume >= vaPct% of total
The POC is the single price level where the most volume was traded — it acts as a magnet because it represents the price at which the most participants found value. The Value Area expands symmetrically from the POC, adding the next-highest adjacent bins until the specified percentage of total volume is captured.
Bull/Bear Delta at Each Level
What makes this profile unique is the delta separation within each price bin. Instead of just showing total volume, the histogram displays bullish volume (green/teal) and bearish volume (pink/red) side by side at each price level. This reveals:
A POC dominated by buying volume suggests buyers control the key level — bullish bias
A POC dominated by selling volume suggests distribution — bearish bias
VAH with heavy selling indicates resistance with institutional distribution
VAL with heavy buying indicates support with institutional accumulation
Levels where bull and bear volume are roughly equal indicate genuine two-way auction — balanced market
Context Scoring System
The context score (0-100) provides an at-a-glance assessment of the current market state relative to the volume profile:
Price Zone Component: Where price sits relative to POC, VAH, and VAL. Price above VAH or below VAL scores higher (trending/breakout conditions). Price near POC scores for mean-reversion potential.
SMA Alignment Component: Whether the 20, 50, and 200 SMAs are aligned in a trending configuration. Full bull alignment (20 > 50 > 200) or bear alignment adds to the score.
POC Proximity: How close price is to the POC level — useful for identifying mean-reversion opportunities or confirming that price is at a key decision point.
Delta Direction: Whether the current cumulative delta supports the price direction.
Institutional Signals
The indicator detects six types of institutional events, each with anti-overlap cooldowns to prevent label stacking:
POC Reclaim: Price crosses above the POC after being below it — indicates buyers are reclaiming the most-traded level, often a bullish continuation signal
POC Rejection: Price approaches the POC and reverses away — the POC is acting as resistance or support
VA Breakout: Price closes outside the Value Area — a statistical extreme that often leads to trend continuation or a sharp reversion
Absorption: High volume with small price range (Wyckoff Effort vs Result) — institutional orders are being filled without moving price, often preceding a directional move
Delta Imbalance: The buy/sell volume ratio at the current level is heavily skewed, indicating one-sided institutional flow
Zone Shift: The Value Area boundaries shift significantly between profile recalculations, indicating a change in the accepted value range
Visual Design
The indicator uses a "Midnight Neon" color theme with electric blues, hot pinks, neon violets, and lime accents on a dark background:
VP Histogram: Horizontal bars drawn as boxes, with bull volume in neon teal and bear volume in hot pink. A sin-based gradient provides smooth color transitions across the histogram.
POC Line: Bright electric blue line at the highest-volume price level, with a label showing the exact price
VAH/VAL Lines: Neon violet lines marking the Value Area boundaries
SMA Lines: 20/50/200 SMAs with neon glow effect for trend context
Signal Labels: Color-coded labels for each institutional signal type with cooldown-based anti-overlap
Context Score: Displayed in the HUD with color coding (green for high scores, amber for moderate, red for low)
HUD Dashboard
The real-time HUD displays key metrics:
POC price level and proximity state (At POC, Near POC, Away)
VAH and VAL price levels with current zone (Above VA, In VA, Below VA)
Context Score (0-100) with color coding
POC Delta direction (Buyers/Sellers/Balanced)
Current Delta value and direction
Effort/Result ratio (Wyckoff absorption detection)
SMA Alignment state (Bull Aligned, Bear Aligned, Mixed)
Volume Ratio (current vs 20-bar average)
Imbalance classification
Input Parameters
Volume Profile:
Lookback (bars): Number of bars to calculate the profile over (default: 100)
Price Levels: Number of horizontal bins to divide the price range into (default: 24)
Value Area %: Percentage of total volume to include in the Value Area (default: 70%)
Display:
Display Mode: Full (histogram + lines), Minimal (lines only), or Off
Histogram Width: How many bars wide the histogram extends (default: 12)
Show SMA Lines: Toggle 20/50/200 SMA overlay
Show Signals: Toggle institutional signal labels
Signal Cooldown: Minimum bars between signals (default: 5)
Show HUD Panel: Toggle the information dashboard
How to Use This Indicator
Step 1: Identify the Value Area
The area between VAH and VAL represents where 70% of volume was traded. Price inside this range is in "fair value." Price outside is in a statistical extreme.
Step 2: Watch the POC
The POC is the strongest magnet on the chart. If price is away from the POC, expect a pull back toward it unless strong momentum keeps price moving. If price is at the POC, watch for a directional break.
Step 3: Read the Delta
Check whether the POC is buyer-dominated or seller-dominated. A buyer-dominated POC in a bullish SMA alignment is a strong confluence for longs. A seller-dominated POC with bearish alignment favors shorts.
Step 4: Use Signals for Timing
POC Reclaim and VA Breakout signals provide timing for entries. Absorption signals warn that a move is being loaded. Delta Imbalance confirms directional conviction.
Step 5: Context Score for Quick Assessment
A context score above 70 suggests strong directional conditions. Below 30 suggests choppy or mean-reverting conditions. Use this to decide whether to trade aggressively or wait.
Best Practices
Volume Profile is most meaningful on instruments with reliable volume data — major forex pairs, large-cap equities, crypto majors
The lookback period should match your trading timeframe. Day traders might use 50-100 bars on a 5-minute chart. Swing traders might use 100-200 bars on a 1-hour chart.
More price levels (rows) give finer resolution but can make the histogram harder to read. 20-30 rows is a good balance.
The POC is not a guaranteed support/resistance level — it is a probability zone. Use it with other confluence factors.
VA Breakouts can be false. Confirm with volume and momentum before trading a breakout above VAH or below VAL.
The delta separation is estimated from candle direction (close vs open), which is an approximation. True tick-level delta requires exchange data not available in Pine Script.
During low-volume periods, the profile may be less representative of true institutional positioning.
Limitations
Volume Profile calculation is computationally intensive. Very large lookback periods (500+ bars) with many price levels may slow chart loading.
The profile is recalculated on each bar, so the POC and VA boundaries can shift as new volume data arrives. This is by design — the profile reflects the most current volume distribution.
Buy/sell volume separation uses candle direction as a proxy, not actual order flow data. This is the standard approximation available in Pine Script.
The indicator draws boxes for the histogram, which counts against TradingView's drawing object limits. The max_boxes_count is set to 500.
On instruments with inconsistent volume reporting (some forex brokers, illiquid stocks), the profile may not accurately represent true volume distribution.
The context score is a heuristic, not a statistical model. It provides a useful summary but should not be the sole basis for trading decisions.
Technical Implementation
Built with Pine Script v6 using:
Custom volume profile calculation with configurable resolution and lookback
Bull/bear volume separation at each price bin
Value Area expansion algorithm (symmetric outward from POC)
Pre-allocated drawing objects updated via set() methods for performance
Sin-based gradient coloring for smooth histogram visual transitions
barstate.isconfirmed gating on all signal generation
Anti-overlap cooldown system for institutional signals
SMA alignment scoring integrated with profile-based context
Alert conditions for POC Reclaim, VA Breakout, Absorption, Delta Imbalance, and Zone Shift
Originality Statement
This indicator is original in its integration of volume profile analysis with institutional signal detection and context scoring. While volume profile calculation is a known concept, this indicator is justified because:
It combines VP histogram visualization with real-time bull/bear delta separation at each price level, revealing who controls each zone
The context scoring system synthesizes price position, SMA alignment, POC proximity, and delta direction into a single actionable metric
Institutional signal detection (POC Reclaim, Absorption, Delta Imbalance) is derived directly from the volume profile data rather than being a separate overlay
The sin-based gradient coloring and Midnight Neon theme provide clear visual hierarchy without the visual noise common in VP indicators
Pre-allocated drawing objects with set() updates provide significantly better performance than creating/deleting objects each bar
The HVN/LVN classification helps traders quickly identify where price will find support/resistance versus where it will move quickly
Disclaimer
This indicator is provided for educational and informational purposes only. It is not financial advice or a recommendation to buy or sell any financial instrument. Volume Profile analysis shows where volume was traded historically — it does not predict where price will go. The POC, VAH, and VAL are probability zones, not certainties. Past volume distributions do not guarantee future price behavior. Always use proper risk management and never risk more than you can afford to lose. The author is not responsible for any losses incurred from using this indicator.
-Made by officialjackofalltrades
インジケーター

Double Edge VP🔷 Double Edge VP
━━━━━━━━━━━━━━━━━━━
Two institutional-grade tools. One indicator. Zero compromise.
This script brings together a dynamic Visible Range Volume Profile and a
non-repainting Double Bottom / Double Top pattern detector into a single
seamless overlay.
If you trade with volume context and price action structure together, this
is the only indicator you need on your chart.
─────────────────────────────────────────────────────────────
🔹 MODULE 1 — VISIBLE RANGE VOLUME PROFILE (VRVP)
─────────────────────────────────────────────────────────────
Most volume profiles are anchored to a fixed session or a manually selected
range. This one is different. The VRVP dynamically recalculates on every
incoming tick based on the exact bars currently visible on your screen.
Scroll left. Zoom in. Zoom out. The profile instantly rebuilds itself to
show the volume distribution for whatever price range you are looking at.
This is how professional traders use volume — not locked to a calendar
session, but alive and responsive to the context they are analyzing.
📌 Point of Control (POC)
The price row with the highest traded volume across the entire visible range.
This is the most accepted price level — the market's center of gravity.
Displayed as a bold golden dashed line spanning the full visible range with
a price label on the right edge. Price has a strong tendency to return to
the POC after extended moves away from it.
📌 Value Area — VAH & VAL
The zone containing 70% of all volume traded in the visible range (percentage
is fully adjustable). Based on the standard Auction Market Theory convention
used by professional futures and equity traders worldwide.
• Price trading inside the Value Area = fair value, expect rotation
• Price trading outside the Value Area = potential imbalance and opportunity
VAH and VAL are rendered as cyan dashed lines with a semi-transparent fill
between them, making the zone immediately readable at any zoom level.
📌 High Volume Nodes (HVN)
Rows where volume is at or above a configurable threshold relative to the POC
(default 75%). These are areas where the market spent significant time and
accepted price — they act as strong support and resistance levels. Price
frequently slows down, consolidates, or reverses at HVNs. Highlighted in teal.
📌 Low Volume Nodes (LVN)
Rows where volume is at or below a configurable threshold relative to the POC
(default 20%). These are price inefficiency zones — areas the market moved
through quickly with minimal acceptance. Price tends to travel rapidly through
LVNs in both directions and often returns to fill them later. Highlighted in red.
📌 Bull / Bear Volume Split
Every profile row is colored by directional dominance — green when buyer-
initiated volume exceeds seller-initiated, red when the opposite is true.
This gives you immediate insight into who controlled each price level, not
just how much volume traded there.
📌 Volume Labels Inside Every Bar
Each profile row displays its actual volume quantity directly inside the bar
itself — for example: 13.926K, 437, 2.8K. This is rendered using Pine
Script's box text parameter rather than label objects, which means every
single row is labeled regardless of Pine's 50-label hard cap. No rows are
ever skipped or silently dropped.
📌 Net Delta Box
The row with the largest absolute imbalance between buyer and seller volume
receives a standalone colored overlay showing the signed delta value —
for example -142 or +3.2K. Red background indicates net selling pressure.
Green background indicates net buying pressure. This single number tells
you where the market's sharpest directional commitment occurred.
─────────────────────────────────────────────────────────────
🔹 MODULE 2 — DOUBLE BOTTOM & DOUBLE TOP DETECTOR (DB/DT)
─────────────────────────────────────────────────────────────
Double Bottoms and Double Tops are among the most reliable reversal patterns
in technical analysis — but most detectors repaint, trigger too early, or
draw signals before the pattern is actually confirmed. This one does not.
Every signal in this detector is generated only after three conditions are
simultaneously true:
1. Two comparable pivot lows (or highs) have been confirmed with full
symmetric lookback on both sides — meaning the pivot cannot be detected
until the required number of bars has passed after it.
2. The price difference between the two pivots falls within your defined
tolerance threshold, ensuring genuine structural similarity.
3. The neckline has been broken by a configurable number of consecutive
bar closes in the signal direction — filtering out wicks, spikes, and
intra-bar noise that would otherwise produce false entries.
Once all three conditions are met, the signal is final and will never be
removed or moved to a different bar.
📌 Double Bottom — Bullish Reversal
Detects two pivot lows of similar price within a configurable bar window.
The neckline is automatically set to the highest high between the two bottoms.
A Long signal fires after the required number of consecutive closes above
the neckline. The indicator draws the "W" pattern connectors, DB labels at
both pivot points, a Long ↗ entry label, and the TP level line.
📌 Double Top — Bearish Reversal
Mirror logic of the Double Bottom. Two pivot highs of similar price within
the bar window. The neckline is the lowest low between the two tops. A Short
signal fires after consecutive closes below the neckline. Draws the "M"
pattern connectors, DT labels, a Short ↘ entry label, and the TP level line.
📌 7 TP / SL Calculation Modes
Choose the method that fits your trading style:
Bottom-to-Neckline → TP projected by the full pattern height (classic AMT)
R/R Ratio → Fixed reward-to-risk multiple, e.g. 2:1 or 3:1
ATR → Levels scaled dynamically by Average True Range
Percent → Fixed percentage distance from entry price
Points → Fixed point distance using syminfo.mintick
Pips → Fixed pip distance for forex instruments
Ticks → Fixed tick distance for futures instruments
📌 Trailing Stop Loss
When enabled, the stop loss moves in the direction of the trade as price
moves favorably, locking in profit while never widening risk. The trail
distance is fixed as the original entry-to-SL gap so your initial risk
profile is always preserved.
📌 TP Visual — Offset Dotted Line
The Take Profit level is displayed as a two-part line: a faint dotted
connector from the signal bar leading to a bold dotted TP segment that
begins a configurable number of bars to the right. This keeps the area
directly around the signal bar clean and readable — the same presentation
style used in institutional strategy publications.
─────────────────────────────────────────────────────────────
📊 LIVE STATISTICS TABLE
─────────────────────────────────────────────────────────────
A performance tracking table displays in your chosen screen position and
updates in real time as new patterns are detected across full chart history.
Tracked separately for Double Bottoms and Double Tops:
→ Total patterns detected
→ Trades triggered (neckline-confirmed signals only)
→ TP hits and SL hits (including trailing stop results)
→ Win rate % — color coded green above 50%, red below
→ Bar distance between pattern points: Min / Average / Median / Max
→ Price % difference between pattern points: Min / Average / Median / Max
Table position is fully configurable: Bottom Right, Bottom Left, Top Right,
Top Left, Middle Right, or Middle Left.
─────────────────────────────────────────────────────────────
🔔 ALERTS
─────────────────────────────────────────────────────────────
Two alert conditions fire on bar close — one for Long signals (Double Bottom
confirmed) and one for Short signals (Double Top confirmed).
Both messages are fully customizable and include the standard TradingView
dynamic placeholders {{ticker}}, {{interval}}, and {{close}} .
─────────────────────────────────────────────────────────────
⚙️ SETTINGS AT A GLANCE
─────────────────────────────────────────────────────────────
All inputs are organized into clearly labeled groups in the settings panel:
Profile → Rows, Value Area %, HVN threshold, LVN threshold
Visual → Profile width, POC / VA / fill / text / delta toggles
Colors → Full color control for every profile element
Detection → Pivot length, bar range, % tolerance, confirm bars,
enable/disable DB and DT independently
TP/SL → Mode selector, ATR settings, % / Points / Pips inputs,
trailing stop toggle, TP line offset and length
Visual → Colors for dots, necklines, signals, pattern lines,
label size, dot size, show/hide toggles
Table → Show/hide, position, text size
Alerts → Custom long and short alert message text
─────────────────────────────────────────────────────────────
📐 TECHNICAL TRANSPARENCY
─────────────────────────────────────────────────────────────
• max_boxes_count = 500 | max_lines_count = 500 | max_labels_count = 500
• VRVP runs only on barstate.islast — profile boxes are cleared and rebuilt
every tick using pooled drawing arrays
• DB/DT runs every bar using individually named persistent var handles —
the two modules share zero drawing objects
• Volume labels use box.new(text=...) to bypass the 50-label hard cap
• All DB/DT signals are strictly non-repainting — confirmed on bar close only
• Trailing stop ratchets forward only, never widens, preserves original risk
─────────────────────────────────────────────────────────────
📌 RECOMMENDED USE
─────────────────────────────────────────────────────────────
This indicator is designed for traders who combine volume analysis with price
action structure. The VRVP provides the context — where volume was accepted,
where it was rejected, and what the market considers fair value right now.
The DB/DT detector provides the trigger — confirmed structural reversals at
levels where the volume profile gives you a reason to act.
Best suited for:
→ Liquid instruments with reliable volume data
(Equities, Futures, Crypto spot markets)
→ Intraday and swing timeframes (1m through Daily)
→ Traders familiar with Auction Market Theory
→ Traders who want pattern detection without repainting
━━━━━━━━━━━━━━━━━━━━━━━━━━━━━━━━━━━━━━━━━━━
Use the VRVP to understand where the market has been.
Use the DB/DT detector to anticipate where it is going next.
━━━━━━━━━━━━━━━━━━━━━━━━━━━━━━━━━━━━━━━━━━━
Disclaimer: This indicator is for educational purposes only. Always practice proper risk management and combine with your own analysis before making trading decisions. Happy trading. インジケーター

Value Area Levels [crlmx]Calculated from native volume-at-price data vaLevels shows Value Area
levels (VAH, POC, VAL) across three independently configurable timeframes.
Requires TradingView Premium or above plan for Footprint data access,
Short of that refere to Lite version (coming soon).
Key Features
- Three independent VA slots with on/off toggles
- Timeframe selection: D, W, M, 30min, 1H, 4H, 8H, 12H
- Session-based VA on slot 3: NYC, London, Asia, Custom
- Custom session with user-defined time window and label prefix
- Auto-calculated row resolution per instrument type
- Manual ticks-per-row override for fine-tuning
- Configurable Value Area percentage (default 68%)
- Individual VAH, POC, VAL toggles per slot
- Optional price display in labels
- Requires TradingView Premium or Ultimate plan
- Streamlined input / UI brought to you by crlmx
Trading Applications
- Map previous day area against weekly and session VAs to identify confluence zones
- Track VAH/VAL as breakout triggers when price moves outside the prior value area
- Compare session VA (NYC/LDN) against daily VA to for reactions
- When daily and weekly VAs overlap, expect stronger reactions at the shared boundary
- Combine with prLevels for a complete prior-level picture (price levels + volume levels)
- Recommended Settings
Intraday S/R: D + W + NYC | Chart: 1-15 min
Session Trading: D + 4H + LDN | Chart: 1-5 min
Swing Reference: D + W + M | Chart: 30 min - 4H
Version History
- v0.10: Initial release
インジケーター

Elite Session Volume Distribution Engine [JOAT]Elite Session Volume Distribution Engine
Introduction
The Elite Session Volume Distribution Engine is an open-source indicator that combines session-based analysis (London, New York, Asian sessions) with volume distribution profiling, VWAP analysis, volume-weighted momentum indicators, and session high/low tracking. This mashup creates a comprehensive session and volume analysis system designed to identify when institutional volume enters the market during specific trading sessions and how that volume is distributed across price levels.
The indicator addresses a critical market reality: different trading sessions have distinct volume characteristics and institutional participation levels. London and New York sessions typically have highest volume and volatility, while Asian session is quieter. By tracking volume distribution, momentum, and key levels within each session, this tool helps traders identify optimal trading windows and understand how institutional volume shapes price action during different global market hours.
Chart showing session boxes, volume distribution, and VWAP on 45M timeframe
Why This Mashup Exists
This indicator combines five analytical frameworks that address different aspects of session-based trading:
Session Identification: Tracks London, New York, and Asian trading sessions
Volume Distribution: Analyzes how volume is distributed across price levels within sessions
VWAP Analysis: Calculates session-specific Volume Weighted Average Price
Volume Momentum: Tracks volume trends and climax conditions
Session High/Low: Identifies key levels established during each session
Each component serves a specific purpose: Session identification shows when institutional traders are active, Volume Distribution reveals where volume concentrates (value areas), VWAP shows institutional average price, Volume Momentum identifies accumulation/distribution phases, and Session High/Low marks key reference levels. Together, they create a complete picture of how institutional volume flows through different trading sessions.
The mashup is justified because these components work together in session-based trading: institutions enter during specific sessions (London/NY), create volume distribution patterns at key levels, establish VWAP as benchmark, show momentum through volume trends, and set session highs/lows that become support/resistance. Tracking all simultaneously reveals the complete session-based institutional flow.
Core Components Explained
1. Session Identification System
The indicator identifies three major trading sessions:
// London Session (03:00-12:00 GMT)
londonSession = input.session("0300-1200", "London Session")
inLondonSession = not na(time(timeframe.period, londonSession))
// New York Session (08:30-17:00 EST)
nySession = input.session("0830-1700", "NY Session")
inNYSession = not na(time(timeframe.period, nySession))
// Asian Session (00:00-09:00 GMT)
asianSession = input.session("0000-0900", "Asian Session")
inAsianSession = not na(time(timeframe.period, asianSession))
// Session overlap (London + NY)
sessionOverlap = inLondonSession and inNYSession
Session characteristics:
London Session: High volume, major currency pairs active, trend establishment
NY Session: Highest volume, US markets active, major moves occur
Asian Session: Lower volume, range-bound often, JPY pairs active
London/NY Overlap: Highest volume period, most volatile, best liquidity
The indicator can optionally display session boxes as background colors (disabled by default to reduce clutter).
2. Volume Distribution Analysis
Volume distribution shows where volume concentrates within price ranges:
// Calculate volume at different price levels
volumeAtPrice = array.new_float()
// For each price level in session range
for i = sessionLow to sessionHigh by tickSize
volumeAtLevel = sum of volume where price traded at level i
array.push(volumeAtPrice, volumeAtLevel)
// Identify Point of Control (POC) - price level with most volume
poc = price level with maximum volume
// Identify Value Area (VA) - price range containing 70% of volume
valueAreaHigh = upper bound of 70% volume
valueAreaLow = lower bound of 70% volume
Volume Distribution concepts:
Point of Control (POC): Price level with highest volume - strong support/resistance
Value Area High (VAH): Upper bound of 70% volume distribution
Value Area Low (VAL): Lower bound of 70% volume distribution
High Volume Nodes: Price levels with significant volume - support/resistance zones
Low Volume Nodes: Price levels with little volume - price moves through quickly
The indicator plots volume distribution as a histogram or profile showing where institutional volume concentrated during the session.
3. Session-Specific VWAP
VWAP resets at the start of each session:
// Session VWAP calculation
var float sessionVWAP = na
var float cumulativeTPV = 0.0 // Typical Price * Volume
var float cumulativeVol = 0.0
if session_start
cumulativeTPV := 0.0
cumulativeVol := 0.0
typicalPrice = (high + low + close) / 3
cumulativeTPV := cumulativeTPV + (typicalPrice * volume)
cumulativeVol := cumulativeVol + volume
sessionVWAP = cumulativeTPV / cumulativeVol
Session VWAP significance:
Institutional traders use VWAP as execution benchmark
Price above session VWAP = buyers in control during session
Price below session VWAP = sellers in control during session
VWAP acts as dynamic support/resistance within session
Distance from VWAP indicates overextension
The indicator plots session VWAP with dynamic coloring based on price position.
4. Volume Momentum Analysis
Volume momentum tracks institutional accumulation/distribution:
// Volume moving average
volumeMA = ta.sma(volume, 20)
// Volume classification
highVolume = volume > volumeMA * 1.5
veryHighVolume = volume > volumeMA * 2.0
climaxVolume = volume > volumeMA * 3.0
// Volume trend
volumeRising = volume > volume and volume > volume
volumeFalling = volume < volume and volume < volume
// Accumulation/Distribution
accumulation = close > open and highVolume and volumeRising
distribution = close < open and highVolume and volumeRising
// Volume momentum indicator
volumeMomentum = (volume - volumeMA) / volumeMA * 100
Volume Momentum signals:
Rising Volume + Up Close: Accumulation - bullish
Rising Volume + Down Close: Distribution - bearish
Climax Volume: Potential exhaustion or strong institutional move
Declining Volume: Lack of institutional interest
Volume Momentum > 50%: Very strong institutional participation
The indicator plots volume bars with color coding based on momentum and direction.
5. Session High/Low Tracking
Session highs and lows become important reference levels:
// Track current session high/low
var float currentSessionHigh = na
var float currentSessionLow = na
if session_start
currentSessionHigh := high
currentSessionLow := low
else
currentSessionHigh := math.max(currentSessionHigh, high)
currentSessionLow := math.min(currentSessionLow, low)
// Previous session levels
prevSessionHigh = currentSessionHigh
prevSessionLow = currentSessionLow
Session High/Low significance:
Current session high/low show intraday range
Previous session levels act as support/resistance
Breaks above previous session high = bullish continuation
Breaks below previous session low = bearish continuation
Session range size indicates volatility and institutional activity
The indicator plots only CURRENT session high/low (2 lines instead of 6) to keep chart clean. Previous session levels can be toggled on if needed.
Example showing session VWAP, volume distribution, and session high/low levels
Volume Distribution Dashboard
The dashboard (bottom-right position) displays:
Current Session: London/NY/Asian/Overlap
Session VWAP: Current VWAP value
Price vs VWAP: Distance from VWAP in %
POC: Point of Control price level
Value Area: VAH and VAL levels
Volume Status: High/Normal/Low relative to average
Volume Momentum: Rising/Falling/Climax
Session Range: High - Low distance
Accumulation/Distribution: Current phase
Visual Elements
Session Boxes: Optional background colors for each session (default: OFF)
Session VWAP: Dynamic line with color based on price position
Session High/Low: Horizontal lines for current session (2 lines only)
Volume Bars: Color-coded based on momentum and direction
Volume Distribution Profile: Histogram showing volume at price levels
POC Line: Horizontal line at Point of Control
Value Area: Shaded zone between VAH and VAL
Accumulation/Distribution Markers: Labels for strong volume phases
Dashboard: Bottom-right table with session and volume metrics
Chart demonstrating session VWAP, volume bars, and dashboard
How Components Work Together
The mashup reveals session-based institutional flow:
Session Trading Sequence:
1. Session Opens: New session begins (London/NY/Asian)
2. VWAP Establishes: Session VWAP forms as volume enters
3. Volume Distribution: Institutions create volume at key levels (POC, Value Area)
4. Session Range: High and low established through institutional activity
5. Volume Momentum: Accumulation or distribution phase identified
6. Session Close: Levels become reference for next session
Example: London session opens, price trades above session VWAP with rising volume (accumulation). Volume distribution shows POC forming at 1.2500 level. Session high reaches 1.2550. NY session opens, price respects London session high and VWAP, continues higher with climax volume. Dashboard shows strong accumulation with volume momentum +75%.
Input Parameters
Session Settings:
London Session: Time range (default: 0300-1200)
NY Session: Time range (default: 0830-1700)
Asian Session: Time range (default: 0000-0900)
Show Session Boxes: Toggle background colors (default: OFF)
Highlight Overlap: Emphasize London/NY overlap (default: enabled)
VWAP Settings:
Show Session VWAP: Toggle VWAP line (default: enabled)
VWAP Reset: Session, Daily, Weekly (default: Session)
VWAP Bands: Optional standard deviation bands (default: disabled)
Distance Alert: Alert when price moves X% from VWAP (default: 2%)
Volume Settings:
Volume MA Length: Period for volume average (default: 20)
High Volume Threshold: Multiplier for high volume (default: 1.5x)
Climax Volume Threshold: Multiplier for climax (default: 3.0x)
Show Volume Bars: Color-coded volume bars (default: enabled)
Show Distribution Profile: Volume at price histogram (default: enabled)
Session Levels:
Show Current Session H/L: Toggle current session levels (default: enabled)
Show Previous Session H/L: Toggle previous session levels (default: disabled)
Show POC: Toggle Point of Control line (default: enabled)
Show Value Area: Toggle VAH/VAL zone (default: enabled)
Display Options:
Show Dashboard: Toggle metrics table (default: enabled)
Dashboard Position: Bottom-right, top-right, etc. (default: bottom-right)
Color Theme: Choose color scheme
Transparency: Adjust visual element transparency
How to Use This Indicator
Step 1: Identify Active Session
Check dashboard to see which session is active. Focus trading during London and NY sessions for highest volume and best opportunities.
Step 2: Monitor Session VWAP
Use session VWAP as directional bias. Price above VWAP = bullish bias, below = bearish bias. VWAP often acts as support/resistance.
Step 3: Check Volume Distribution
Identify POC and Value Area. These levels often provide strong support/resistance. Price tends to return to POC (fair value).
Step 4: Assess Volume Momentum
Check if volume is rising (accumulation/distribution) or falling (lack of interest). Climax volume often marks important turning points.
Step 5: Use Session High/Low
Current session high/low define intraday range. Breaks above/below these levels signal potential breakout moves.
Step 6: Watch for Session Transitions
Session opens and closes often bring volatility. London open and NY open are particularly important for major moves.
Best Practices
Use on 5-minute to 1-hour timeframes for optimal session analysis
London/NY overlap (08:30-12:00 EST) offers highest volume and best opportunities
Session VWAP acts as magnet - price often returns to it
POC from previous session often becomes support/resistance in current session
Climax volume at session high/low often marks reversal points
Accumulation during Asian session often leads to breakout during London open
Value Area breaks signal strong directional moves
Previous session high/low become key levels for current session
Combine session analysis with other technical tools for best results
Indicator Limitations
Session times are fixed and may not account for daylight saving time changes
Volume distribution requires sufficient data within session to be meaningful
VWAP can be less relevant in very volatile or trending markets
Session high/low can be broken multiple times in volatile conditions
Lower timeframes may show choppy session transitions
Volume data quality varies across different markets and brokers
Asian session analysis less reliable due to lower volume
Requires understanding of session-based trading concepts
Visual elements can clutter chart if all options enabled
Technical Implementation
Built with Pine Script v6 using:
Session detection using time() function with session strings
Session-specific VWAP calculation with reset logic
Volume distribution profiling with POC and Value Area calculation
Volume momentum tracking with MA comparison
Session high/low tracking with persistent variables
Accumulation/distribution detection using volume and price
Dynamic dashboard with real-time session metrics
Optional session boxes with transparency control
Color-coded volume bars based on momentum
The code is fully open-source and can be modified to adjust session times, volume thresholds, and visual preferences.
Originality Statement
This indicator is original in its comprehensive session and volume integration approach. While individual components (session identification, VWAP, volume distribution, volume momentum, session high/low) are established concepts, this mashup is justified because:
It combines session-based analysis with volume distribution profiling
Session-specific VWAP provides more relevant institutional benchmark than daily VWAP
Integration of volume momentum with session context reveals accumulation/distribution phases
Simplified visual presentation (current session H/L only) reduces clutter
Dashboard presents complex session and volume data clearly
Focus on institutional trading sessions (London/NY) aligns with volume reality
Each component contributes unique information: Session identification shows when institutions are active, Volume Distribution reveals where they're trading, VWAP shows their average price, Volume Momentum shows their intent, and Session High/Low marks their range. The mashup's value lies in presenting these complementary session-based perspectives simultaneously, allowing traders to understand how institutional volume flows through different global trading sessions.
Disclaimer
This indicator is provided for educational and informational purposes only. It is not financial advice or a recommendation to buy or sell any financial instrument. Trading involves substantial risk of loss and is not suitable for all investors.
Session-based analysis and volume distribution are analytical tools that analyze past data. They do not predict future price movement or guarantee that institutional traders are active at identified levels. Market conditions change, and session patterns that worked historically may not work in the future.
VWAP and volume distribution levels can fail to provide support/resistance. Session highs and lows can be broken without leading to sustained moves. Volume momentum can change rapidly. Past session behavior does not guarantee future session behavior.
Always use proper risk management, including stop losses and position sizing appropriate for your account size and risk tolerance. Never risk more than you can afford to lose. Consider consulting with a qualified financial advisor before making investment decisions.
The author is not responsible for any losses incurred from using this indicator. Users assume full responsibility for all trading decisions made using this tool.
-Made with passion by officialjackofalltrades インジケーター

Volume Profile Skew [BackQuant]Volume Profile Skew
Overview
Volume Profile Skew is a market-structure indicator that answers a specific question most volume profiles do not:
“Is volume concentrating toward lower prices (accumulation) or higher prices (distribution) inside the current profile range?”
A standard volume profile shows where volume traded, but it does not quantify the shape of that distribution in a single number. This script builds a volume profile over a rolling lookback window, extracts the key profile levels (POC, VAH, VAL, and a volume-weighted mean), then computes the skewness of the volume distribution across price bins. That skewness becomes an oscillator, smoothed into a regime signal and paired with visual profile plotting, key level lines, and historical POC tracking.
This gives you two layers at once:
A full profile and its important levels (where volume is).
A skew metric (how volume is leaning within that range).
What this indicator is based on
The foundation comes from classical “volume at price” concepts used in Market Profile and Volume Profile analysis:
POC (Point of Control): the price level with the highest traded volume.
Value Area (VAH/VAL): the zone containing the bulk of activity, commonly 70% of total volume.
Volume-weighted mean (VWMP in this script): the average price weighted by volume, a “center of mass” for traded activity.
Where this indicator extends the idea is by treating the volume profile as a statistical distribution across price. Once you treat “volume by price bin” as a probability distribution (weights sum to 1), you can compute distribution moments:
Mean: where the mass is centered.
Standard deviation: how spread-out it is.
Skewness: whether the distribution has a heavier tail toward higher or lower prices.
This is not a gimmick. Skewness is a standard statistic in probability theory. Here it is applied to “volume concentration across price”, not to returns.
Core concept: what “skew” means in a volume profile
Imagine a profile range from Low to High, split into bins. Each bin has some volume. You can get these shapes:
Balanced profile: volume is fairly symmetric around the mean, skew near 0.
Bottom-heavy profile: more volume at lower prices, with a tail toward higher prices, skew tends to be positive.
Top-heavy profile: more volume at higher prices, with a tail toward lower prices, skew tends to be negative.
In this script:
Positive skew is labeled as ACCUMULATION.
Negative skew is labeled as DISTRIBUTION.
Near-zero skew is NEUTRAL.
Important: accumulation here does not mean “buying will immediately pump price.” It means the profile shape suggests more participation at lower prices inside the current lookback range. Distribution means participation is heavier at higher prices.
How the volume profile is built
1) Define the analysis window
The profile is computed on a rolling window:
Lookback Period: number of bars included (capped by available history).
Profile Resolution (bins): number of price bins used to discretize the high-low range.
The script finds the highest high and lowest low in the lookback window to define the price range:
rangeHigh = highest high in window
rangeLow = lowest low in window
binSize = (rangeHigh - rangeLow) / bins
2) Create bin midpoints
Each bin gets a midpoint “price” used for calculations:
price = rangeLow + binSize * (b + 0.5)
These midpoints are what the mean, variance, and skewness are computed on.
3) Distribute each candle’s volume into bins
This is a key implementation detail. Real volume profiles require tick-level data, but Pine does not provide that. So the script approximates volume-at-price using candle ranges:
For each bar in the lookback:
Determine which bins its low-to-high range touches.
Split that candle’s total volume evenly across the touched bins.
So if a candle spans 6 bins, each bin gets volume/6 from that bar. This is a practical, consistent approximation for “where trading could have occurred” inside the bar.
This approach has tradeoffs:
It does not know where within the candle the volume truly traded.
It assumes uniform distribution across the candle range.
It becomes more meaningful with larger samples (bigger lookback) and/or higher timeframes.
But it is still useful because the purpose here is the shape of the distribution across the whole window, not exact microstructure.
Key profile levels: POC, VAH, VAL, VWMP
POC (Point of Control)
POC is found by scanning bins and selecting the bin with maximum volume. The script stores:
pocIndex: which bin has max volume
poc price: midpoint price of that bin
Value Area (VAH/VAL) using 70% volume
The script builds the value area around the POC outward until it captures 70% of total volume:
Start with the POC bin.
Expand one bin at a time to the side with more volume.
Stop when accumulated volume >= 70% of total profile volume.
Then:
VAL = rangeLow + binSize * lowerIdx
VAH = rangeLow + binSize * (upperIdx + 1)
This produces a classic “where most business happened” zone.
VWMP (Volume-Weighted Mean Price)
This is essentially the center of mass of the profile:
VWMP = sum(price * volume ) / totalVolume
It is similar in spirit to VWAP, but it is computed over the profile bins, not from bar-by-bar typical price.
Skewness calculation: turning the profile into an oscillator
This is the main feature.
1) Treat volumes as weights
For each bin:
weight = volume / totalVolume
Now weights sum to 1.
2) Compute weighted mean
Mean price:
mean = sum(weight * price )
3) Compute weighted variance and std deviation
Variance:
variance = sum(weight * (price - mean)^2)
stdDev = sqrt(variance)
4) Compute weighted third central moment
Third moment:
m3 = sum(weight * (price - mean)^3)
5) Standardize to skewness
Skewness:
rawSkew = m3 / (stdDev^3)
This standardization matters. Without it, the value would explode or shrink based on profile scale. Standardized skewness is dimensionless and comparable.
Smoothing and regime rules
Raw skewness can be jumpy because:
profile bins change as rangeHigh/rangeLow shift,
one high-volume candle can reshape the distribution,
volume regimes change quickly in crypto.
So the indicator applies EMA smoothing:
smoothedSkew = EMA(rawSkew, smooth)
Then it classifies regime using fixed thresholds:
Bullish (ACCUMULATION): smoothedSkew > +0.25
Bearish (DISTRIBUTION): smoothedSkew < -0.25
Neutral: between those values
Signals are generated on threshold cross events:
Bull signal when smoothedSkew crosses above +0.25
Bear signal when smoothedSkew crosses below -0.25
This makes the skew act like a regime oscillator rather than a constantly flipping color.
Volume Profile plotting modes
The script draws the profile on the last bar, using boxes for each bin, anchored to the right with a configurable offset. The width of each profile bar is normalized by max bin volume:
volRatio = binVol / maxVol
barWidth = volRatio * width
Three style modes exist:
1) Gradient
Uses a “jet-like” gradient based on volRatio (blue → red). Higher-volume bins stand out naturally. Transparency increases as volume decreases, so low-volume bins fade.
2) Solid
Uses the current regime color (bull/bear/neutral) for all bins, with transparency. This makes the profile read as “structure + regime.”
3) Skew Highlight
Highlights bins that match the skew bias:
If skew bullish, emphasize lower portion of profile.
If skew bearish, emphasize higher portion of profile.
Else, keep most bins neutral.
This is a visual “where the skew is coming from” mode.
Historical POC tracking and Naked POCs
This script also treats POCs as meaningful levels over time, similar to how traders track old VA levels.
What is a “naked POC”?
A “naked POC” is a previously formed POC that has not been revisited (retested) by price since it was recorded. Many traders watch these as potential reaction zones because they represent prior “maximum traded interest” that the market has not re-engaged with.
How this script records POCs
It stores a new historical POC when:
At least updatebars have passed since the last stored POC, and
The POC has changed by at least pochangethres (%) from the last stored value.
New stored POCs are flagged as naked by default.
How naked becomes tested
On each update, the script checks whether price has entered a small zone around a naked POC:
zoneSize = POC * 0.002 (about 0.2%)
If bar range overlaps that zone, mark it as tested (not naked).
Display controls:
Highlight Naked POCs: draws and labels untested POCs.
Show Tested POCs: optionally draw tested ones in a muted color.
To avoid clutter, the script limits stored POCs to the most recent 20 and avoids drawing ones too close to the current POC.
On-chart key levels and what they mean
When enabled, the script draws the current lookback profile levels on the price chart:
POC (solid): the “most traded” price.
VAH/VAL (dashed): boundaries of the 70% value area.
VWMP (dotted): volume-weighted mean of the profile distribution.
Interpretation framework (practical, not mystical):
POC often behaves like a magnet in balanced conditions.
VAH/VAL define the “accepted” area, breaks can signal auction continuation.
VWMP is a fair-value reference, useful as a mean anchor when skew is neutralizing.
Oscillator panel and histogram
The skew oscillator is plotted in a separate pane:
Line: smoothedSkew, colored by regime.
Histogram: smoothedSkew as bars, colored by sign.
Fill: subtle shading above/below 0 to reinforce bias.
This makes it easy to read:
Direction of bias (positive vs negative).
Strength (distance from 0 and from thresholds).
Transitions (crosses of ±0.25).
Info table: what it summarizes
On the last bar, a table prints key diagnostics:
Current skew value (smoothed).
Regime label (ACCUMULATION / DISTRIBUTION / NEUTRAL).
Current POC, VAH, VAL, VWMP.
Count of naked POCs still active.
A simple “volume location” hint (lower/higher/balanced).
This is designed for quick scanning without reading the entire profile.
Alerts
The indicator includes alerts for:
Skew regime shifts (cross above +0.25, cross below -0.25).
Price crossing above/below current POC.
Approaching a naked POC (within 1% of any active naked POC).
The “approaching naked POC” alert is useful as a heads-up that price is entering a historically important volume magnet/reaction zone.
How to use it properly
1) Regime filter
Use skew regime to decide what type of trades you should prioritize:
ACCUMULATION (positive skew): market activity is heavier at lower prices, pullbacks into value or below VWMP often matter more.
DISTRIBUTION (negative skew): activity is heavier at higher prices, rallies into value or above VWMP often matter more.
NEUTRAL: mean-reversion and POC magnet behavior tends to dominate.
This is not “buy when green.” It is context for what the auction is doing.
2) Level-based execution
Combine skew with VA/POC levels:
In neutral regimes, expect rotations around POC and inside VA.
In strong skew regimes, watch for acceptance away from POC and reactions at VA edges.
3) Naked POCs as targets and reaction zones
Naked POCs can act like unfinished business. Common workflows:
As targets in rotations.
As areas to reduce risk when price is approaching.
As “if it breaks cleanly, trend continuation” markers when price returns with force.
Parameter tuning guidance
Lookback
Controls how “local” the profile is.
Shorter: reacts faster, more sensitive to recent moves.
Longer: more stable, better for swing context.
Bins
Controls resolution of the profile.
Higher bins: more detail, more computation, more sensitive profile shape.
Lower bins: smoother, less detail, more stable skew.
Smoothing
Controls how noisy the skew oscillator is.
Higher smoothing: fewer regime flips, slower response.
Lower smoothing: more responsive, more false transitions.
POC tracking settings
Update interval and threshold decide how many historical POCs you store and how different they must be. If you set them too loose, you will spam levels. If too strict, you will miss meaningful shifts.
Limitations and what not to assume
This indicator uses candle-range volume distribution because Pine cannot see tick-level volume-at-price. That means:
The profile is an approximation of where volume could have traded, not exact tape data.
Skew is best treated as a structural bias, not a precise signal generator.
Extreme single-bar events can distort the distribution briefly, smoothing helps but cannot remove reality.
Summary
Volume Profile Skew takes standard volume profile structure (POC, Value Area, volume-weighted mean) and adds a statistically grounded measure of profile shape using skewness. The result is a regime oscillator that quantifies whether volume concentration is leaning toward lower prices (accumulation) or higher prices (distribution), while also plotting the full profile, key levels, and historical naked POCs for actionable context.
インジケーター

インジケーター

Volume Profile Area [BigBeluga]🔵 OVERVIEW
The Volume Profile Area is an advanced profiling tool that calculates and visualizes the value area within a chosen period’s volume distribution. It first builds a main profile of the entire range, then constructs a secondary profile inside the defined value area, allowing traders to examine market balance and key trading zones in greater detail.
🔵 CONCEPTS
Volume Profile – Distributes traded volume across price levels to highlight areas of market activity.
Value Area (VA) – The price range containing a chosen percentage of total volume (commonly 50–70%).
Point of Control (PoC) – The price level with the highest traded volume, often acting as a magnet for price.
Nested Profiles – A profile inside the VA adds a second layer of precision, showing where liquidity clusters within the “fair value” zone.
🔵 FEATURES
Main Profile – Full distribution of volume over the selected lookback period.
Secondary Profile – Built only inside the VA of the main profile, highlighting intrabalance structure.
Customizable PoC Selection – Choose between showing the PoC of the
Main Profile ,
the Area Profile ,
their Average ,
or None .
Dynamic Value Area Levels – Automatically plots VAL (Value Area Low) and VAH (Value Area High) with labels.
Overlay Toggles – Show/hide range extremes, VA lines, or PoCs for a cleaner chart view.
Visual Profiles – Main profile shaded in darker blue; the VA profile inside is lighter for clear separation.
Automatic Scaling – Profiles adapt to period highs/lows and auto-adjust bins for consistent resolution.
Volume Labels – PoCs can display traded volume, giving numeric confirmation of liquidity concentration.
🔵 HOW TO USE
Set the Period to define how many bars to include in the main profile.
Adjust the Value Area % to control how much volume defines the VA (e.g., 50% by default).
Pick your PoC option: Main , Area , or Average , depending on focus.
Use VAH/VAL lines as support/resistance levels where most trading occurred.
Compare reactions at Main vs VA PoC levels to spot potential breakouts or mean reversions.
🔵 CONCLUSION
The Volume Profile Area extends traditional profiling by nesting a secondary VA profile inside the main distribution. This dual-layer approach reveals not just where the market was active overall, but where liquidity concentrated within the “fair value” zone—powerful for refining entries, exits, and risk placement across intraday and swing horizons. インジケーター

インジケーター

RTH Levels: VWAP + PDH/PDL + ONH/ONL + IBAlgo Index — Levels Pro (ONH/ONL • PDH/PDL • VWAP±Bands • IB • Gaps)
Purpose. A session-aware, non-repainting levels tool for intraday decision-making. Designed for futures and indices, with clean visuals, alerts, and a one-click Minimal Mode for screenshot-ready charts.
What it plots
• PDH/PDL (RTH-only) – Prior Regular Trading Hours high/low, computed intraday and frozen at the RTH close (no 24h mix-ups, no repainting).
• ONH/ONL – Prior Overnight high/low, held throughout RTH.
• RTH VWAP with ±σ bands – Volume-weighted variance, reset each RTH.
• Initial Balance (IB) – First N minutes of RTH, plus 1.5× / 2.0× extensions after IB completes.
• Today’s RTH Open & Prior RTH Close – With gap detection and “gap filled” alert.
• Killzone shading – NY Open (09:30–10:30 ET) and Lunch (11:15–13:30 ET).
• Values panel (top-right) – Each level with live distance in points & ticks.
• Right-edge level tags – With anti-overlap (stagger + vertical jitter).
• Price-scale tags – Native trackprice markers that always “stick” to the axis.
⸻
New in v6.4
• Minimal Mode: one click for a clean look (thinner lines, VWAP bands/IB extensions hidden, on-chart right-edge labels off; price-scale tags remain).
• Theme presets: Dark Hi-Contrast / Light Minimal / Futures Classic / Muted Dark.
• Anti-overlap controls: horizontal staggering, vertical jitter, and baseline offset to keep tags readable even when levels cluster.
⸻
Quick start (2 minutes)
1. Add to chart → keep defaults.
2. Sessions (ET):
• RTH Session default: 09:30–16:00 (US equities cash hours).
• Overnight Session default: 18:00–09:29.
Adjust for your market if you use different “day” hours (e.g., many use 08:20–13:30 ET for COMEX Gold).
3. Theme & Minimal Mode: pick a Theme Preset; enable Minimal Mode for screenshots.
4. Visibility: toggle PD/ON/VWAP/IB/References/Panel to taste.
5. Right-edge labels: turn Show Right-Edge Labels on. If they crowd, tune:
• Anti-overlap: min separation (ticks)
• Horizontal offset per tag (bars)
• Vertical jitter per step (ticks)
• Right-edge baseline offset (bars)
6. Alerts: open Add alert → Condition: and pick the events you want.
⸻
How levels are computed (no repainting)
• PDH/PDL: Intraday H/L are accumulated only while in RTH and saved at RTH close for “yesterday’s” values.
• ONH/ONL: Accumulated across the defined Overnight window and then held during RTH.
• RTH VWAP & ±σ: Volume-weighted mean and standard deviation, reset at the RTH open.
• IB: First N minutes of RTH (default 60). Extensions (1.5×/2.0×) appear after IB completes.
• Gaps: Today’s RTH open vs prior RTH close; “Gap Filled” triggers when price trades back to prior close.
⸻
Practical playbooks (how to trade around the levels)
1) PDH/PDL interactions
• Rejection: Price taps PDH/PDL then closes back inside → mean-reversion toward VWAP/IB.
• Acceptance: Close/hold beyond PDH/PDL with momentum → continuation to next HTF/IB target.
• Alert: PD Touch/Break.
2) ONH/ONL “taken”
• Often one ON extreme is taken during RTH. ONH Taken / ONL Taken → check if it’s a clean break or sweep & reclaim.
• Sweep + reclaim near VWAP can fuel rotations through the ON range.
3) VWAP ±σ framework
• Balanced: First tag of ±1σ often reverts toward VWAP.
• Trend: Persistent trade beyond ±1σ + IB break → target ±2σ/±3σ.
• Alerts: VWAP Cross and VWAP Reject (cross then immediate fail back).
4) IB breaks
• After IB completes, a clean IB break commonly targets 1.5× and sometimes 2.0×.
• Quick return inside IB = possible fade back to the opposite IB edge/VWAP.
• Alerts: IB Break Up / Down.
5) Gaps
• Gap-and-go: Opening drive away from prior close + VWAP support → trend until IB completion.
• Gap-fill: Weak open and VWAP overhead/underfoot → trade toward prior close; manage on Gap Filled alert.
Pro tip: Stack confluences (e.g., ONL sweep + VWAP reclaim + IB hold) and respect your execution rules (e.g., require a 5-minute close in direction, or your order-flow confirmation).
⸻
Inputs you’ll actually touch
• Sessions (ET): Session Timezone, RTH Session, Overnight Session.
• Visibility: toggles for PD/ON/VWAP/IB/Ref/Panel.
• VWAP bands: set σ multipliers (±1/±2/±3).
• IB: duration (minutes) and extension multipliers (1.5× / 2.0×).
• Style & Theme: Theme Preset, Main Line Width, Trackprice, Minimal Mode, and anti-overlap controls.
⸻
Alerts included
• PD Touch/Break — High ≥ PDH or Low ≤ PDL
• ONH Taken / ONL Taken — First in-RTH take of ONH/ONL
• VWAP Cross — Close crosses VWAP
• VWAP Reject — Cross then immediate fail back
• IB Break Up / Down — Break of IB High/Low after IB completes
• Gap Filled — Price trades back to prior RTH close
Setup: Add alert → Condition: Algo Index — Levels Pro → choose event → message → Notify on app/email.
⸻
Panel guide
The top-right panel shows each level plus live distance from last price:
LevelValue (Δpoints | Δticks)
Coloring: green if level is below current price, red if above.
⸻
Styling & screenshot tips
• Use Theme Preset that matches your chart.
• For dark charts, “Dark Hi-Contrast” with Main Line Width = 3 works well.
• Enable Trackprice for crisp axis tags that always stick to the right edge.
• Turn on Minimal Mode for cleaner screenshots (no VWAP bands or IB extensions, on-chart tags off; price-scale tags remain).
• If tags crowd, increase min separation (ticks) to 30–60 and horizontal offset to 3–5; add vertical jitter (4–12 ticks) and/or push tags farther right with baseline offset (bars).
⸻
Behavior & limitations
• Levels are computed incrementally; tables refresh on the last bar for efficiency.
• Right-edge labels are placed at bar_index + offset and do not track extra right-margin scrolling (TradingView limitation). The price-scale tags (from trackprice) do track the axis.
• “RTH” is what you define in inputs. If your market uses different day hours, change the session strings so PDH/PDL reflect your definition of “yesterday’s session.”
⸻
FAQ
Q: My PDH/PDL don’t match the daily chart.
A: By design this uses RTH-only highs/lows, not 24h daily bars. Adjust sessions if you want a different definition.
Q: Right-edge tags overlap or don’t sit at the far right.
A: Increase min separation / horizontal offset / vertical jitter and/or push tags farther with baseline offset. If you want markers that always hug the axis, rely on Trackprice.
Q: Can I change killzones?
A: Yes—edit the session strings in settings or request a version with user inputs for custom windows.
⸻
Disclaimer
Educational use only. This is not financial advice. Always apply your own risk management and confirmation rules.
⸻
Enjoy it? Please ⭐ the script and share screenshots using Minimal Mode + a Theme Preset that fits your style. インジケーター

Advanced Volume Profile Pro Delta + POC + VAH/VAL# Advanced Volume Profile Pro - Delta + POC + VAH/VAL Analysis System
## WHAT THIS SCRIPT DOES
This script creates a comprehensive volume profile analysis system that combines traditional volume-at-price distribution with delta volume calculations, Point of Control (POC) identification, and Value Area (VAH/VAL) analysis. Unlike standard volume indicators that show only total volume over time, this script analyzes volume distribution across price levels and estimates buying vs selling pressure using multiple calculation methods to provide deeper market structure insights.
## WHY THIS COMBINATION IS ORIGINAL AND USEFUL
**The Problem Solved:** Traditional volume indicators show when volume occurs but not where price finds acceptance or rejection. Standalone volume profiles lack directional bias information, while basic delta calculations don't provide structural context. Traders need to understand both volume distribution AND directional sentiment at key price levels.
**The Solution:** This script implements an integrated approach that:
- Maps volume distribution across price levels using configurable row density
- Estimates delta (buying vs selling pressure) using three different methodologies
- Identifies Point of Control (highest volume price level) for key support/resistance
- Calculates Value Area boundaries where 70% of volume traded
- Provides real-time alerts for key level interactions and volume imbalances
**Unique Features:**
1. **Developing POC Visualization**: Real-time tracking of Point of Control migration throughout the session via blue dotted trail, revealing institutional accumulation/distribution patterns before they complete
2. **Multi-Method Delta Calculation**: Price Action-based, Bid/Ask estimation, and Cumulative methods for different market conditions
3. **Adaptive Timeframe System**: Auto-adjusts calculation parameters based on chart timeframe for optimal performance
4. **Flexible Profile Types**: N Bars Back (precise control), Days Back (calendar-based), and Session-based analysis modes
5. **Advanced Imbalance Detection**: Identifies and highlights significant buying/selling imbalances with configurable thresholds
6. **Comprehensive Alert System**: Monitors POC touches, Value Area entry/exit, and major volume imbalances
## HOW THE SCRIPT WORKS TECHNICALLY
### Core Volume Profile Methodology:
**1. Price Level Distribution:**
- Divides price range into user-defined rows (10-50 configurable)
- Calculates row height: `(Highest Price - Lowest Price) / Number of Rows`
- Distributes each bar's volume across price levels it touched proportionally
**2. Delta Volume Calculation Methods:**
**Price Action Method:**
```
Price Range = High - Low
Buy Pressure = (Close - Low) / Price Range
Sell Pressure = (High - Close) / Price Range
Buy Volume = Total Volume × Buy Pressure
Sell Volume = Total Volume × Sell Pressure
Delta = Buy Volume - Sell Volume
```
**Bid/Ask Estimation Method:**
```
Average Price = (High + Low + Close) / 3
Buy Volume = Close > Average ? Volume × 0.6 : Volume × 0.4
Sell Volume = Total Volume - Buy Volume
```
**Cumulative Method:**
```
Buy Volume = Close > Open ? Volume : Volume × 0.3
Sell Volume = Close ≤ Open ? Volume : Volume × 0.3
```
**3. Point of Control (POC) Identification:**
- Scans all price levels to find maximum volume concentration
- POC represents the price level with highest trading activity
- Acts as significant support/resistance level
- **Developing POC Feature**: Tracks POC evolution in real-time via blue dotted trail, showing how institutional interest migrates throughout the session. Upward POC migration indicates accumulation patterns, downward migration suggests distribution, providing early trend signals before price confirmation.
**4. Value Area Calculation:**
- Starts from POC and expands up/down to encompass 70% of total volume
- VAH (Value Area High): Upper boundary of value area
- VAL (Value Area Low): Lower boundary of value area
- Expansion algorithm prioritizes direction with higher volume
**5. Adaptive Range Selection:**
Based on profile type and timeframe optimization:
- **N Bars Back**: Fixed lookback period with performance optimization (20-500 bars)
- **Days Back**: Calendar-based analysis with automatic timeframe adjustment (1-365 days)
- **Session**: Current trading session or custom session times
### Performance Optimization Features:
- **Sampling Algorithm**: Reduces calculation load on large datasets while maintaining accuracy
- **Memory Management**: Clears previous drawings to prevent performance degradation
- **Safety Constraints**: Prevents excessive memory usage with configurable limits
## HOW TO USE THIS SCRIPT
### Initial Setup:
1. **Profile Configuration**: Select profile type based on trading style:
- N Bars Back: Precise control over data range
- Days Back: Intuitive calendar-based analysis
- Session: Real-time session development
2. **Row Density**: Set number of rows (30 default) - more rows = higher resolution, slower performance
3. **Delta Method**: Choose calculation method based on market type:
- Price Action: Best for trending markets
- Bid/Ask Estimate: Good for ranging markets
- Cumulative: Smoothed approach for volatile markets
4. **Visual Settings**: Configure colors, position (left/right), and display options
### Reading the Profile:
**Volume Bars:**
- **Length**: Represents relative volume at that price level
- **Color**: Green = net buying pressure, Red = net selling pressure
- **Intensity**: Darker colors indicate volume imbalances above threshold
**Key Levels:**
- **POC (Blue Line)**: Highest volume price - major support/resistance
- **VAH (Purple Dashed)**: Value Area High - upper boundary of fair value
- **VAL (Orange Dashed)**: Value Area Low - lower boundary of fair value
- **Value Area Fill**: Shaded region showing main trading range
**Developing POC Trail:**
- **Blue Dotted Lines**: Show real-time POC evolution throughout the session
- **Migration Patterns**: Upward trail indicates bullish accumulation, downward trail suggests bearish distribution
- **Early Signals**: POC movement often precedes price movement, providing advance warning of institutional activity
- **Institutional Footprints**: Reveals where smart money concentrated volume before final POC establishment
### Trading Applications:
**Support/Resistance Analysis:**
- POC acts as magnetic price level - expect reactions
- VAH/VAL provide intermediate support/resistance levels
- Profile edges show areas of low volume acceptance
**Developing POC Analysis:**
- **Upward Migration**: POC moving higher = institutional accumulation, bullish bias
- **Downward Migration**: POC moving lower = institutional distribution, bearish bias
- **Stable POC**: Tight clustering = balanced market, range-bound conditions
- **Early Trend Detection**: POC direction change often precedes price breakouts
**Entry Strategies:**
- Buy at VAL with POC as target (in uptrends)
- Sell at VAH with POC as target (in downtrends)
- Breakout plays above/below profile extremes
**Volume Imbalance Trading:**
- Strong buying imbalance (>60% threshold) suggests continued upward pressure
- Strong selling imbalance suggests continued downward pressure
- Imbalances near key levels provide high-probability setups
**Multi-Timeframe Context:**
- Use higher timeframe profiles for major levels
- Lower timeframe profiles for precise entries
- Session profiles for intraday trading structure
## SCRIPT SETTINGS EXPLANATION
### Volume Profile Settings:
- **Profile Type**: Determines data range for calculation
- N Bars Back: Exact number of bars (20-500 range)
- Days Back: Calendar days with timeframe adaptation (1-365 days)
- Session: Trading session-based (intraday focus)
- **Number of Rows**: Profile resolution (10-50 range)
- **Profile Width**: Visual width as chart percentage (10-50%)
- **Value Area %**: Volume percentage for VA calculation (50-90%, 70% standard)
- **Auto-Adjust**: Automatically optimizes for different timeframes
### Delta Volume Settings:
- **Show Delta Volume**: Enable/disable delta calculations
- **Delta Calculation Method**: Choose methodology based on market conditions
- **Highlight Imbalances**: Visual emphasis for significant volume imbalances
- **Imbalance Threshold**: Percentage for imbalance detection (50-90%)
### Session Settings:
- **Session Type**: Daily, Weekly, Monthly, or Custom periods
- **Custom Session Time**: Define specific trading hours
- **Previous Sessions**: Number of historical sessions to display
### Days Back Settings:
- **Lookback Days**: Number of calendar days to analyze (1-365)
- **Automatic Calculation**: Script automatically converts days to bars based on timeframe:
- Intraday: Accounts for 6.5 trading hours per day
- Daily: 1 bar per day
- Weekly/Monthly: Proportional adjustment
### N Bars Back Settings:
- **Lookback Bars**: Exact number of bars to analyze (20-500)
- **Precise Control**: Best for systematic analysis and backtesting
### Visual Customization:
- **Colors**: Bullish (green), Bearish (red), and level colors
- **Profile Position**: Left or Right side of chart
- **Profile Offset**: Distance from current price action
- **Labels**: Show/hide level labels and values
- **Smooth Profile Bars**: Enhanced visual appearance
### Alert Configuration:
- **POC Touch**: Alerts when price interacts with Point of Control
- **VA Entry/Exit**: Alerts for Value Area boundary interactions
- **Major Imbalance**: Alerts for significant volume imbalances
## VISUAL FEATURES
### Profile Display:
- **Horizontal Bars**: Volume distribution across price levels
- **Color Coding**: Delta-based coloring for directional bias
- **Smooth Rendering**: Optional smoothing for cleaner appearance
- **Transparency**: Configurable opacity for chart readability
### Level Lines:
- **POC**: Solid blue line with optional label
- **VAH/VAL**: Dashed colored lines with value displays
- **Extension**: Lines extend across relevant time periods
- **Value Area Fill**: Optional shaded region between VAH/VAL
### Information Table:
- **Current Values**: Real-time POC, VAH, VAL prices
- **VA Range**: Value Area width calculation
- **Positioning**: Multiple table positions available
- **Text Sizing**: Adjustable for different screen sizes
## IMPORTANT USAGE NOTES
**Realistic Expectations:**
- Volume profile analysis provides structural context, not trading signals
- Delta calculations are estimations based on price action, not actual order flow
- Past volume distribution does not guarantee future price behavior
- Combine with other analysis methods for comprehensive market view
**Best Practices:**
- Use appropriate profile types for your trading style:
- Day Trading: Session or Days Back (1-5 days)
- Swing Trading: Days Back (10-30 days) or N Bars Back
- Position Trading: Days Back (60-180 days)
- Consider market context (trending vs ranging conditions)
- Verify key levels with additional technical analysis
- Monitor profile development for changing market structure
**Performance Considerations:**
- Higher row counts increase calculation complexity
- Large lookback periods may affect chart performance
- Auto-adjust feature optimizes for most use cases
- Consider using session profiles for intraday efficiency
**Limitations:**
- Delta calculations are estimations, not actual transaction data
- Profile accuracy depends on available price/volume history
- Effectiveness varies across different instruments and market conditions
- Requires understanding of volume profile concepts for optimal use
**Data Requirements:**
- Requires volume data for accurate calculations
- Works best on liquid instruments with consistent volume
- May be less effective on very low volume or exotic instruments
This script serves as a comprehensive volume analysis tool for traders who need detailed market structure information with integrated directional bias analysis and real-time POC development tracking for informed trading decisions. インジケーター

Market sessions and Volume profile - By LeviathanThis script allows you to keep track of Forex market sessions (Tokyo, London and New York), as well as Daily, Weekly and Monthly sessions. All of them are accompanied by Volume Profile options where you can view VP Histogram, Point of Control, Value Area High and Value Area Low.
Colors, lines and other design preferences are fully customizable.
* Volume Profile of shorter sessions (eg. Tokyo, London, New York) works better when using lower timeframes such as 15min, 5min, etc.
** Use timeframe higher than 15min when viewing Monthly sessions
Indicator settings overview:
SESSION TYPE
- Tokyo session (1:00 - 9:00 UTC/ GMT )
- London session (7:00 - 16:00 UTC/ GMT )
- New York session (13:00 - 22:00 UTC/ GMT )
- Daily session
- Weekly session
- Monthly session
DISPLAY
- Show Volume Profile (Show or hide Volume Profile histogram)
- Show POC (Show or hide Point Of Control line)
- Show VAL (Show or hide Value Area Low line)
- Show VAH (Show or hide Value Area High line)
- Show Live Zone (Show or hide the ongoing session)
VOLUME PROFILE SETTINGS
- Resolution (The higher the value, the more refined of a profile, but less profiles are shown on the chart)
- Smooth Volume Data (Useful for assets that have very large spikes in volume over large bars, helps create better profiles)
APPEARANCE
- Up Volume color (Pick a custom color for up/ bullish volume profile nodes)
- Down Volume color (Pick a custom color for down/ bearish volume profile nodes)
- POC color and thickness (Pick a custom color and thickness for Point Of Control line)
- VAH color and thickness (Pick a custom color and thickness for Value Area High line)
- VAL color and thickness (Pick a custom color and thickness for Value Area Low line)
- Session box thickness (Pick a custom thickness for the session box. Color is provided automatically with optimal contrast)
** Some VP elements are inspired by @LonesomeTheBlue's volume profile script インジケーター

Volume/Market ProfileVolume/Market Profile is a 2 in 1 Volume Profile and Market Profile Indicator.
This indicator is my own calculations for compiling a volume profile and market profile.
The profile is progressively calculated live as the chart develops.
I have made use of both Boxes AND Lines to allow me to display a finer granularity profile by displaying up to twice the max amount of lines allowed in tradingview.
I have spent a lot of time to make sure the values are getting appended exactly as intended so that I can assure this profile is operating as precisely as possible within the limitations of the data available.
To make my calculations easier to use in other places, I have made my volume profile a function that can be extracted and used whenever you need values from a volume profile.
Feel free to read through the script if you don't understand how this profile is developed. I have made a commentary of my volume profile function to help you understand what exactly happens to compile the profiles.
As mentioned before, This indicator doubles as a market profile. To view both at the same time you will need to add the indicator on your chart twice.
I have built in comprehensive customizations to allow you to display your profiles however fits your needs.
Timeframe: The aggregation period for profiles, to see a 1 week profile, change the timeframe to 1 week.
Note: You can add custom timeframes by adding a custom timeframe in your chart timeframe dropdown menu. When you add timeframes in this area, they appear as options within indicators with the timeframe input.
Sensitivity: Allows for greater or less granularity changes. The calculation method for granularity automatically changes depending on the range of your chart.
Note: Multiply this value by 100 and that will be the max range (in ticks) of your price before the indicator automatically adjusts to make the profile less granular. (ex. If price ranges $1, and 1 tick is $0.01, granularity will be 0.01 with a sensitivity of 1+)
Value Area %: % of total volume to display as the value zone. (_% of total profile values are contained within the value zone)
Calculate as Market Profile: Uses a 1 Instead of the candle volume, to display a Market Profile. (If selected POC -> TPOC)
Display Size: Sets the # of bars from the profile axis to the profile's max value. If set negative, profile will be displayed left of axis, if positive, profile will be displayed to the right of the axis.
Display Offset: Sets the # of bars in front(or behind) the current chart bar to set the axis of the profile. If negative, the axis will be to the left of the current chart bar, if positive the axis will be right of the current chart bar.
Display Historical POC/VAH/VAL: Choose to display historical poc,vah,val lines.
Colors: I'm not explaining colors.
Enjoy! インジケーター

インジケーター

インジケーター

Volume Profile [Makit0]VOLUME PROFILE INDICATOR v0.5 beta
Volume Profile is suitable for day and swing trading on stock and futures markets, is a volume based indicator that gives you 6 key values for each session: POC, VAH, VAL, profile HIGH, LOW and MID levels. This project was born on the idea of plotting the RTH sessions Value Areas for /ES in an automated way, but you can select between 3 different sessions: RTH, GLOBEX and FULL sessions.
Some basic concepts:
- Volume Profile calculates the total volume for the session at each price level and give us market generated information about what price and range of prices are the most traded (where the value is)
- Value Area (VA): range of prices where 70% of the session volume is traded
- Value Area High (VAH): highest price within VA
- Value Area Low (VAL): lowest price within VA
- Point of Control (POC): the most traded price of the session (with the most volume)
- Session HIGH, LOW and MID levels are also important
There are a huge amount of things to know of Market Profile and Auction Theory like types of days, types of openings, relationships between value areas and openings... for those interested Jim Dalton's work is the way to come
I'm in my 2nd trading year and my goal for this year is learning to daytrade the futures markets thru the lens of Market Profile
For info on Volume Profile: TV Volume Profile wiki page at www.tradingview.com
For info on Market Profile and Market Auction Theory: Jim Dalton's book Mind over markets (this is a MUST)
BE AWARE: this indicator is based on the current chart's time interval and it only plots on 1, 2, 3, 5, 10, 15 and 30 minutes charts.
This is the correlation table TV uses in the Volume Profile Session Volume indicator (from the wiki above)
Chart Indicator
1 - 5 1
6 - 15 5
16 - 30 10
31 - 60 15
61 - 120 30
121 - 1D 60
This indicator doesn't follow that correlation, it doesn't get the volume data from a lower timeframe, it gets the data from the current chart resolution.
FEATURES
- 6 key values for each session: POC (solid yellow), VAH (solid red), VAL (solid green), profile HIGH (dashed silver), LOW (dashed silver) and MID (dotted silver) levels
- 3 sessions to choose for: RTH, GLOBEX and FULL
- select the numbers of sessions to plot by adding 12 hours periods back in time
- show/hide POC
- show/hide VAH & VAL
- show/hide session HIGH, LOW & MID levels
- highlight the periods of time out of the session (silver)
- extend the plotted lines all the way to the right, be careful this can turn the chart unreadable if there are a lot of sessions and lines plotted
SETTINGS
- Session: select between RTH (8:30 to 15:15 CT), GLOBEX (17:00 to 8:30 CT) and FULL (17:00 to 15:15 CT) sessions. RTH by default
- Last 12 hour periods to show: select the deph of the study by adding periods, for example, 60 periods are 30 natural days and around 22 trading days. 1 period by default
- Show POC (Point of Control): show/hide POC line. true by default
- Show VA (Value Area High & Low): show/hide VAH & VAL lines. true by default
- Show Range (Session High, Low & Mid): show/hide session HIGH, LOW & MID lines. true by default
- Highlight out of session: show/hide a silver shadow over the non session periods. true by default
- Extension: Extend all the plotted lines to the right. false by default
HOW TO SETUP
BE AWARE THIS INDICATOR PLOTS ONLY IN THE FOLLOWING CHART RESOLUTIONS: 1, 2, 3, 5, 10, 15 AND 30 MINUTES CHARTS. YOU MUST SELECT ONE OF THIS RESOLUTIONS TO THE INDICATOR BE ABLE TO PLOT
- By default this indicator plots all the levels for the last RTH session within the last 12 hours, if there is no plot try to adjust the 12 hours periods until the seesion and the periods match
- For Globex/Full sessions just select what you want from the dropdown menu and adjust the periods to plot the values
- Show or hide the levels you want with the 3 groups: POC line, VA lines and Session Range lines
- The highlight and extension options are for a better visibility of the levels as POC or VAH/VAL
THANKS TO
@watsonexchange for all the help, ideas and insights on this and the last two indicators (Market Delta & Market Internals) I'm working on my way to a 'clean chart' but for me it's not an easy path
@PineCoders for all the amazing stuff they do and all the help and tools they provide, in special the Script-Stopwatch at that was key in lowering this indicator's execution time
All the TV and Pine community, open source and shared knowledge are indeed the best way to help each other
IF YOU REALLY LIKE THIS WORK, please send me a comment or a private message and TELL ME WHAT you trade, HOW you trade it and your FAVOURITE SETUP for pulling out money from the market in a consistent basis, I'm learning to trade (this is my 2nd year) and I need all the help I can get
GOOD LUCK AND HAPPY TRADING インジケーター

Volume Profile Free Ultra SLI (100 Levels Value Area VWAP) - RRBVolume Profile Free Ultra SLI by RagingRocketBull 2019
Version 1.0
This indicator calculates Volume Profile for a given range and shows it as a histogram consisting of 100 horizontal bars.
This is basically the MAX SLI version with +50 more Pinescript v4 line objects added as levels.
It can also show Point of Control (POC), Developing POC, Value Area/VWAP StdDev High/Low as dynamically moving levels.
Free accounts can't access Standard TradingView Volume Profile, hence this indicator.
There are several versions: Free Pro, Free MAX SLI, Free Ultra SLI, Free History. This is the Free Ultra SLI version. The Differences are listed below:
- Free Pro: 25 levels, +Developing POC, Value Area/VWAP High/Low Levels, Above/Below Area Dimming
- Free MAX SLI: 50 levels, 2x SLI modes for Buy/Sell or even higher res 150 levels
- Free Ultra SLI: 100 levels, packed to the limit, 2x SLI modes for Buy/Sell or even higher res 300 levels
- Free History: auto highest/lowest, historic poc/va levels for each session
Features:
- High-Res Volume Profile with up to 100 levels (line implementation)
- 2x SLI modes for even higher res: 300 levels with 3x vertical SLI, 100 buy/sell levels with 2x horiz SLI
- Calculate Volume Profile on full history
- POC, Developing POC Levels
- Buy/Sell/Total volume modes
- Side Cover
- Value Area, VAH/VAL dynamic levels
- VWAP High/Low dynamic levels with Source, Length, StdDev as params
- Show/Hide all levels
- Dim Non Value Area Zones
- Custom Range with Highlighting
- 3 Anchor points for Volume Profile
- Flip Levels Horizontally
- Adjustable width, offset and spacing of levels
- Custom Color for POC/VA/VWAP levels, Transparency for buy/sell levels
WARNING:
- Compilation Time: 1 min 20 sec
Usage:
- specify max_level/min_level/spacing (required)
- select range (start_bar, range length), confirm with range highlighting
- select volume type: Buy/Sell/Total
- select mode Value Area/VWAP to show corresponding levels
- flip/select anchor point to position the buy/sell levels
- use Horiz Buy/Sell SLI mode with 100 or Vertical SLI with 300 levels if needed
- use POC/Developing POC/VA/VWAP High/Low as S/R levels. Usually daily values from 1-3 days back are used as levels for the current day.
SLI:
use SLI modes to extend the functionality of the indicator:
- Horiz Buy/Sell 2x SLI lets you view 100 Buy/Sell Levels at the same time
- Vertical Max_Vol 3x SLI lets you increase the resolution to 300 levels
- you need at least 2 instances of the indicator attached to the same chart for SLI to work
1) Enable Horiz SLI:
- attach 2 indicator instances to the chart
- make sure all instances have the same min_level/max_level/range/spacing settings
- select volume type for each instance: you can have a buy/sell or buy/total or sell/total SLI. Make sure your buy volume instance is the last attached to be displayed on top of sell/total instances without overlapping.
- set buy_sell_sli_mode to true for indicator instances with volume_type = buy/sell, for type total this is optional.
- this basically tells the script to calculate % lengths based on total volume instead of individual buy/sell volumes and use ext offset for sell levels
- Sell Offset is calculated relative to Buy Offset to stack/extend sell after buy. Buy Offset = Zero - Buy Length. Sell Offset = Buy Offset - Sell Length = Zero - Buy Length - Sell Length
- there are no master/slave instances in this mode, all indicators are equal, poc/va levels are not affected and can work independently, i.e. one instance can show va levels, another - vwap.
2) Enable Vertical SLI:
- attach the first instance and evaluate the full range to roughly determine where is the highest max_vol/poc level i.e. 0..20000, poc is in the bottom half (third, middle etc) or
- add more instances and split the full vertical range between them, i.e. set min_level/max_level of each corresponding instance to 0..10000, 10000..20000 etc
- make sure all instances have the same range/spacing settings
- an instance with a subrange containing the poc level of the full range is now your master instance (bottom half). All other instances are slaves, their levels will be calculated based on the max_vol/poc of the master instance instead of local values
- set show_max_vol_sli to true for the master instance. for slave instances this is optional and can be used to check if master/slave max_vol values match and slave can read the master's value. This simply plots the max_vol value
- you can also attach all instances and set show_max_vol_sli to true in all of them - the instance with the largest max_vol should become the master
Auto/Manual Ext Max_Vol Modes:
- for auto vertical max_vol SLI mode set max_vol_sli_src in all slave instances to the max_vol of the master indicator: "VolumeProfileFree_MAX_RRB: Max Volume for Vertical SLI Mode". It can be tricky with 2+ instances
- in case auto SLI mode doesn't work - assign max_vol_sli_ext in all slave instances the max_vol value of the master indicator manually and repeat on each change
- manual override max_vol_sli_ext has higher priority than auto max_vol_sli_src when both values are assigned, when they are 0 and close respectively - SLI is disabled
- master/slave max_vol values must match on each bar at all times to maintain proper level scale, otherwise slave's levels will look larger than they should relative to the master's levels.
- Max_vol (red) is the last param in the long list of indicator outputs
- the only true max_vol/poc in this SLI mode is the master's max_vol/poc. All poc/va levels in slaves will be irrelevant and are disabled automatically. Slaves can only show VWAP levels.
- VA Levels of the master instance in this SLI mode are calculated based on the subrange, not the whole range and may be inaccurate. Cross check with the full range.
WARNING!
- auto mode max_vol_sli_src is experimental and may not work as expected
- you can only assign auto mode max_vol_sli_src = max_vol once due to some bug with unhandled exception/buffer overflow in Tradingview. Seems that you can clear the value only by removing the indicator instance
- sometimes you may see a "study in error state" error when attempting to set it back to close. Remove indicator/Reload chart and start from scratch
- volume profile may not finish to redraw and freeze in an ugly shape after an UI parameter change when max_vol_sli_src is assigned a max_vol value. Assign it to close - VP should redraw properly, but it may not clear the assigned max_vol value
- you can't seem to be able to assign a proper auto max_vol value to the 3rd slave instance
- 2x Vertical SLI works and tested in both auto/manual, 3x SLI - only manual seems to work (you can have a mixed mode: 2nd instance - auto, 3rd - manual)
Notes:
- This code uses Pinescript v3 compatibility framework
- This code is 20x-30x faster (main for cycle is removed) especially on lower tfs with long history - only 4-5 sec load/redraw time vs 30-60 sec of the old Pro versions
- Instead of repeatedly calculating the total sum of volumes for the whole range on each bar, vol sums are now increased on each bar and passed to the next in the range making it a per range vs per bar calculation that reduces time dramatically
- 100 levels consist of 50 main plot levels and 50 line objects used as alternate levels, differences are:
- line objects are always shown on top of other objects, such as plot levels, zero line and side cover, it's not possible to cover/move them below.
- all line objects have variable lengths, use actual x,y coords and don't need side cover, while all plot levels have a fixed length of 100 bars, use offset and require cover.
- all key properties of line objects, such as x,y coords, color can be modified, objects can be moved/deleted, while this is not possible for static plot levels.
- large width values cause line objects to expand only up/down from center while their length remains the same and stays within the level's start/end points similar to an area style.
- large width values make plot levels expand in all directions (both h/v), beyond level start/end points, sometimes overlapping zero line, making them an inaccurate % length representation, as opposed to line objects/plot levels with area style.
- large width values translate into different widths on screen for line objects and plot levels.
- you can't compensate for this unwanted horiz width expansion of plot levels because width uses its own units, that don't translate into bars/pixels.
- line objects are visible only when num_levels > 50, plot levels are used otherwise
- Since line objects are lines, plot levels also use style line because other style implementations will break the symmetry/spacing between levels.
- if you don't see a volume profile check range settings: min_level/max_level and spacing, set spacing to 0 (or adjust accordingly based on the symbol's precision, i.e. 0.00001)
- you can view either of Buy/Sell/Total volumes, but you can't display Buy/Sell levels at the same time using a single instance (this would 2x reduce the number of levels). Use 2 indicator instances in horiz buy/sell sli mode for that.
- Volume Profile/Value Area are calculated for a given range and updated on each bar. Each level has a fixed length. Offsets control visible level parts. Side Cover hides the invisible parts.
- Custom Color for POC/VA/VWAP levels - UI Style color/transparency can only change shape's color and doesn't affect textcolor, hence this additional option
- Custom Width - UI Style supports only width <= 4, hence this additional option
- POC is visible in both modes. In VWAP mode Developing POC becomes VWAP, VA High and Low => VWAP High and Low correspondingly to minimize the number of plot outputs
- You can't change buy/sell level colors from input (only transparency) - this requires 2x plot outputs => 2x reduces the number of levels to fit the max 64 limit. That's why 2 additional plots are used to dim the non Value Area zones
- You can change level transparency of line objects. Due to Pinescript limitations, only discrete values are supported.
- Inverse transp correlation creates the necessary illusion of "covered" line objects, although they are shown on top of the cover all the time
- If custom lines_transp is set the illusion will break because transp range can't be skewed easily (i.e. transp 0..100 is always mapped to 100..0 and can't be mapped to 50..0)
- transparency can applied to lines dynamically but nva top zone can't be completely removed because plot/mixed type of levels are still used when num_levels < 50 and require cover
- transparency can't be applied to plot levels dynamically from script this can be done only once from UI, and you can't change plot color for the past length bars
- All buy/sell volume lengths are calculated as % of a fixed base width = 100 bars (100%). You can't set show_last from input to change it
- Range selection/Anchoring is not accurate on charts with time gaps since you can only anchor from a point in the future and measure distance in time periods, not actual bars, and there's no way of knowing the number of future gaps in advance.
- Adjust Width for Log Scale mode now also works on high precision charts with small prices (i.e. 0.00001)
- in Adjust Width for Log Scale mode Level1 width extremes can be capped using max deviation (when level1 = 0, shift = 0 width becomes infinite)
- There's no such thing as buy/sell volume, there's just volume, but for the purposes of the Volume Profile method, assume: bull candle = buy volume, bear candle = sell volume
P.S. I am your grandfather, Luke! Now, join the Dark Side in your father's steps or be destroyed! Once more the Sith will rule the Galaxy, and we shall have peace...
インジケーター