🔵 Introduction The "Zig Zag" indicator is an analytical tool that emerges from pricing changes. Essentially, it connects consecutive high and low points in an oscillatory manner. This method helps decipher price changes and can also be useful in identifying traditional patterns. By sifting through partial price changes, "Zig Zag" can effectively pinpoint...
This is yet another ZigZag library. 🔵 Key Features 1. Lightning-Fast Performance : Optimized code ensures minimal lag and swift chart updates. 2. Real-Time Swing Detection : No more waiting for swings to finalize! This library continuously identifies the latest swing formation. 3. Amplitude-Aware : Discover significant swings earlier, even if they haven't...
🔵 Introduction "Zigzag" is an indicator that forms based on price changes. Essentially, the function of this indicator is to connect consecutive and alternating High and Low pivots. This pattern assists in analyzing price changes and can also be used to identify classic patterns. "Zigzag" is an analytical tool that, by filtering partial price movements based on...
Auto Fibonacci tools are powerful ways designed to simplify your technical analysis by automatically drawing Fibonacci retracement and extension levels on your chart. This indicator is built to enhance your trading experience with clearer market moves and informative insights. You can easily spot your waves and patterns when the percentages are moving with you. ...
Library "ZigLib" Calculate the points for ZigZag++. You can use custom data and resolution for your ZigZag++. Sample Usage import DevLucem/ZigLib/1 as ZigZag = ZigZag.zigzag(low, high) bgcolor(direction<0? color.rgb(255, 82, 82, 80): color.rgb(0, 230, 119, 80)) line zz = line.new(z1.time, z1.price, z2.time, z2.price, xloc.bar_time, width=3) if...
Hello! This script "The Next Pivot" uses various similarity measures to compare historical price sequences to the current price sequence! Features Find the most similar price sequence up to 100 bars from the current bar Forecast price path up to 250 bars Forecast ZigZag up to 250 bars Spearmen Pearson Absolute Difference Cosine Similarity Mean...
Zigzag Indicator with Trend-based Color Coding and Info Table This indicator is forked from Trendoscope's Recursive Zigzag The Zigzag Indicator with Trend-based Color Coding and Info Table is a powerful tool for technical analysis, designed to help you identify significant price swings, visualize trends, and analyze pivot points with ease. This advanced...
V V V V V V V Please Read V V V V V V V I ask Peter and he is fine, that im published this script Tell me if you have some ideas or criticism about that sricpt >>>>>>>>>> This is a modified Version of Peter_O's Momentum Based ZigZag <<<<<<<<<<< This is only a test, and i want to share it with the community It works like other ZigZags Because Peters_O's...
this indicator looks like the default ZigZag indicator but it uses the price action instead of the deviation%
The Zig Zag indicator is a useful indicator when it comes to visualizing past underlying trends in the price and can make the process of using drawing tools easier. The indicator consists of a series of lines connecting points where the price deviates more than a specific percentage from a maximum/minimum point ultimately connecting local peaks and troughs. This...
The Fibonacci Channel is a technical analysis tool that is used to estimate support and resistance levels based on the Fibonacci numbers. It is a variation of the Fibonacci retracement tool, except with the channel the lines run diagonally rather than horizontally. This study will automatically place the channels where the levels indicate future areas of...
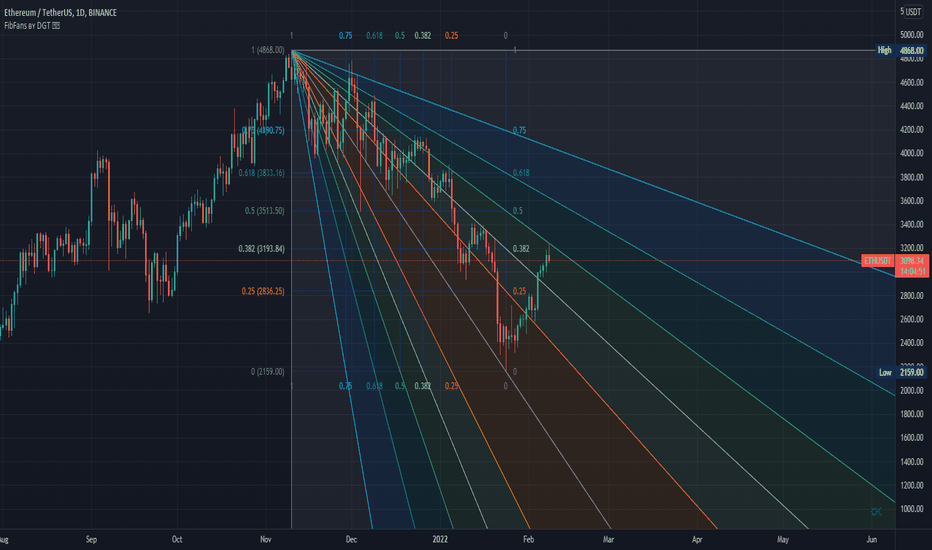
Fibonacci Speed and Resistance Fan is an analytical drawing tool used to indicate the support and resistance levels of an existing trend and the price level at which possible changes in the trend may occur. A Fibonacci Speed Resistance Fan consists of a trend line drawn between two extreme points - a trough and opposing peak or a peak and opposing trough - on...
Hey Awesome Traders I noticed people were so happy with my ZigZag lucemanb script and so I made one that is more user-friendly and customizable Please note the original one is dedicated to developers, The code is very minimal for fast understanding when anyone wants to use it in their development In this script, I have included several features like...
THIS CODE IS BASED FROM THE MT4 ZIGZAG INDICATOR THE ZIGZAG SETTINGS FOR THE MAIN ONE ON TRADINGVIEW DO NOT WORK THE SAME AS MT4 I HOPE U LOVE IT I have had tons of experience on the ZIGZAG indicator and thought this might help someone. Enjoy this code. Zigzag is a good indicator in many ways and people underestimate it because of its repainting Check out...
![ZigZag Library [TradingFinder] EURJPY: ZigZag Library [TradingFinder]](https://s3.tradingview.com/i/IGrDHMhJ_mid.png)


![ZigZag Multi [TradingFinder] Trend & Wave Lines - Structures XAUUSD: ZigZag Multi [TradingFinder] Trend & Wave Lines - Structures](https://s3.tradingview.com/t/tMhLigMe_mid.png)


![The Next Pivot [Kioseff Trading] SPY: The Next Pivot [Kioseff Trading]](https://s3.tradingview.com/p/pLzwXOug_mid.png)

![Zigzag Trend-based Color [SteinG] BTCUSDT: Zigzag Trend-based Color [SteinG]](https://s3.tradingview.com/y/YWH7OAVH_mid.png)

![Modified QQE-ZigZag [Non Repaint During Candle Building] BTCPERP: Modified QQE-ZigZag [Non Repaint During Candle Building]](https://s3.tradingview.com/f/fJVMc2eU_mid.png)


![Zig Zag Channels [LuxAlgo] BTCUSD: Zig Zag Channels [LuxAlgo]](https://s3.tradingview.com/a/a2PJSO1p_mid.png)


