Techniques
How can I prevent the “Bar index value of the x argument is too far from the current bar index. Try using time instead” and “Objects positioned using xloc.bar_index cannot be drawn further than X bars into the future” errors?
Both these errors occur when creating objects too distant from the current bar. An x point on a line, label, or box can not be more than 9999 bars in the past or more than 500 bars in the future relative to the bar on which the script draws it.
Scripts can draw objects beyond these limits, however, using xloc.bar_time instead of the xloc parameter, and time as an alternative to bar_index for the x arguments.
Note that, by default, all drawings use xloc.bar_index, which means that the values passed to their x-coordinates are treated as if they are bar indices. If drawings use a time-based value without specifying xloc = xloc.bar_time, the timestamp — which is usually an int value of trillions of milliseconds — is treated as an index of a bar in the future, and inevitably exceeds the 500 future bars limit. To use time-based values for drawings, always specify xloc.bar_time.
How can I update the right side of all lines or boxes?
Scripts can update the x2 value of all lines or boxes by storing them in an array and using a for…in loop to iterate over each object. Update the x2 value using the line.set_x2() or box.set_right()
functions.
In the example below, we create a custom array and go over it to extend lines with each new bar:
As an alternative to adding new drawings to a custom array, scripts can use the appropriate built-in variable that collects all instances of a drawing type. These arrays use the <drawingNamespace>.all naming scheme: for example, scritps can access all drawn labels by referring to label.all, all polylines with polyline.all, etc. Scripts can iterate over these arrays in the same way as with custom arrays.
This example implements gets the same result using the line.all built-in array instead:
How to avoid repainting when not using the request.security() function?
Scripts can give deceptive output if they repaint by behaving differently on historical and elapsed realtime bars. This type of repainting is most commonly caused by requesting data from another context using the request.security() function.
Scripts can also change their output during a realtime bar, as the volume, close, high, and low values change. This form of repainting is not normally deceptive or detrimental.
To avoid this kind of repainting and ensure that outputs do not change during a bar, consider the following options:
- Use confirmed values, or the values from the previous bar.
- Set alerts to fire on bar close. Read more about repainting alerts in the FAQ entry Why is my alert firing at the wrong time?
- Use the open in calculations instead of the close.
For further exploration of these methods, see the PineCoders publication “How to avoid repainting when NOT using security()“.
How can I trigger a condition n bars after it last occurred?
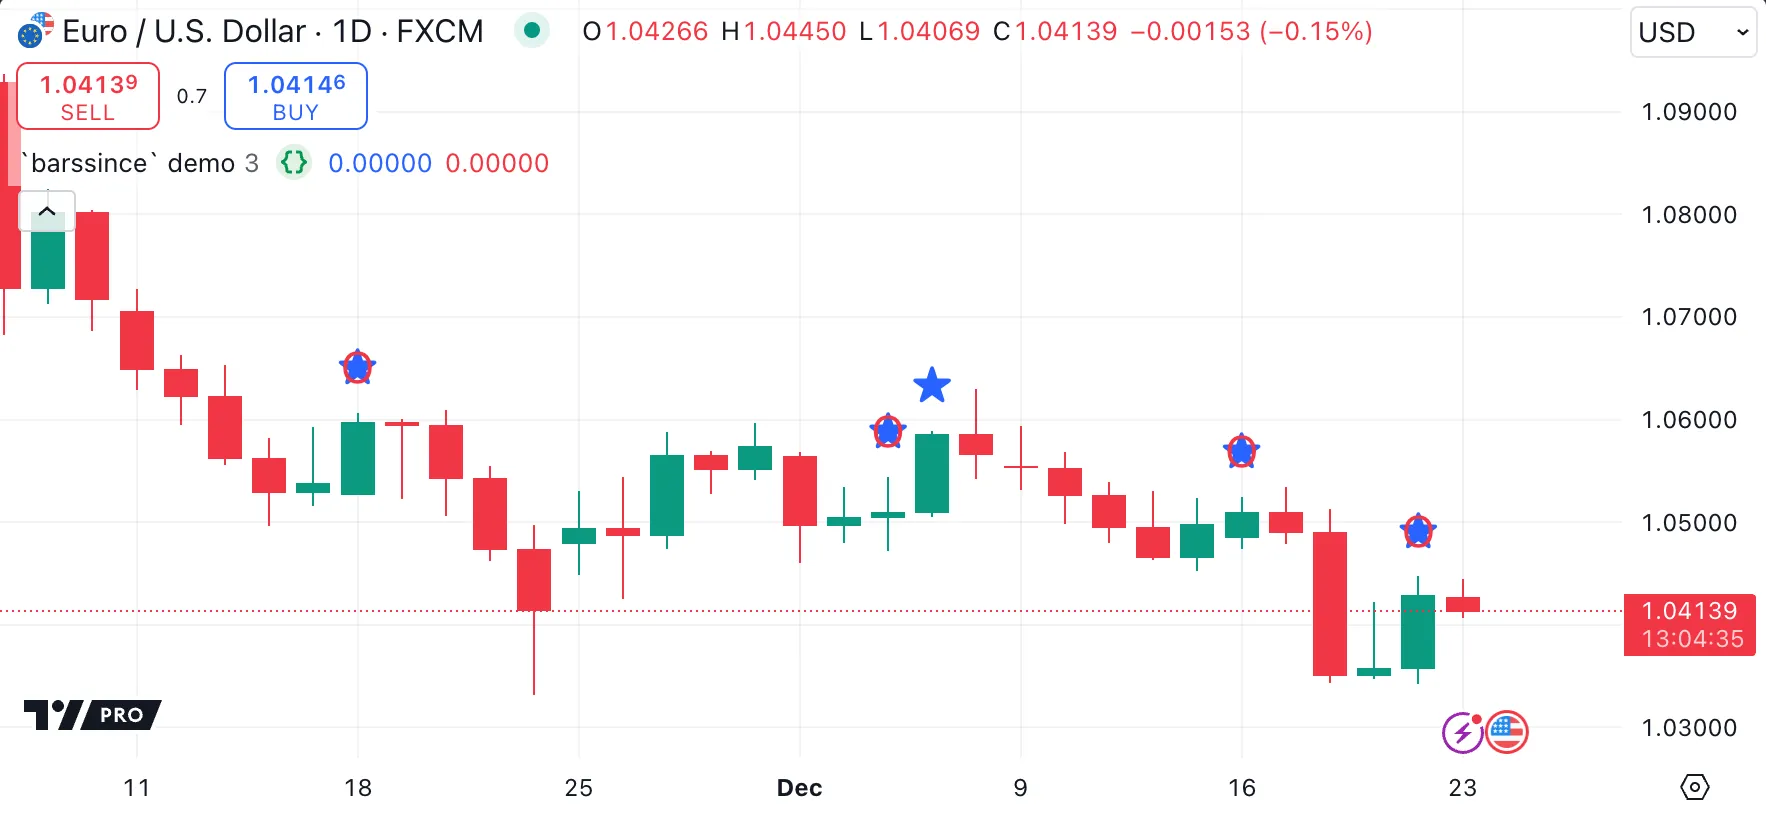
Using the ta.barssince() function, scripts can implement a condition when a certain number of bars have elapsed since the last occurrence of that condition.
The following example script uses the cond condition to plot a blue star when the close value is greater than the open value for two consecutive bars. Then, the trigger variable is true only if the cond condition is already true and the number of bars elapsed since cond was last true is greater than lengthInput. The script plots a red “O” on the chart, overlaying the blue star, each time these conditions are met. The Data Window displays the count since cond was last true.
How can my script identify what chart type is active?
Various boolean built-in variables within the chart.* namespace enable a script to detect the type of chart it is running on.
The following example script defines a function, chartTypeToString(), which uses the chart.* built-ins to identify the chart type and convert this information into
a string. It then displays the detected chart type in a table on the chart.
How can I plot the highest and lowest visible candle values?
To plot the highest high and lowest low within the range of visible bars, a script can use the chart.left_visible_bar_time and chart.right_visible_bar_time built-ins. These variables allow the script to identify the times of the earliest and latest visible bars on the chart and calculate the maximum or minimum values within that range.
The VisibleChart library by PineCoders offers such functionality with its high() and low() functions, which dynamically calculate the highest and lowest values of the currently visible bars.
The following example script uses functions from this library to create two horizontal lines on the chart, signifying the highest and lowest price points within the range of visible bars. The script draws labels for these lines, displaying both the price and the corresponding timestamp for each high and low point. As the chart is manipulated through scrolling or zooming, these lines and labels dynamically update to reflect the highest and lowest values of the newly visible bars:
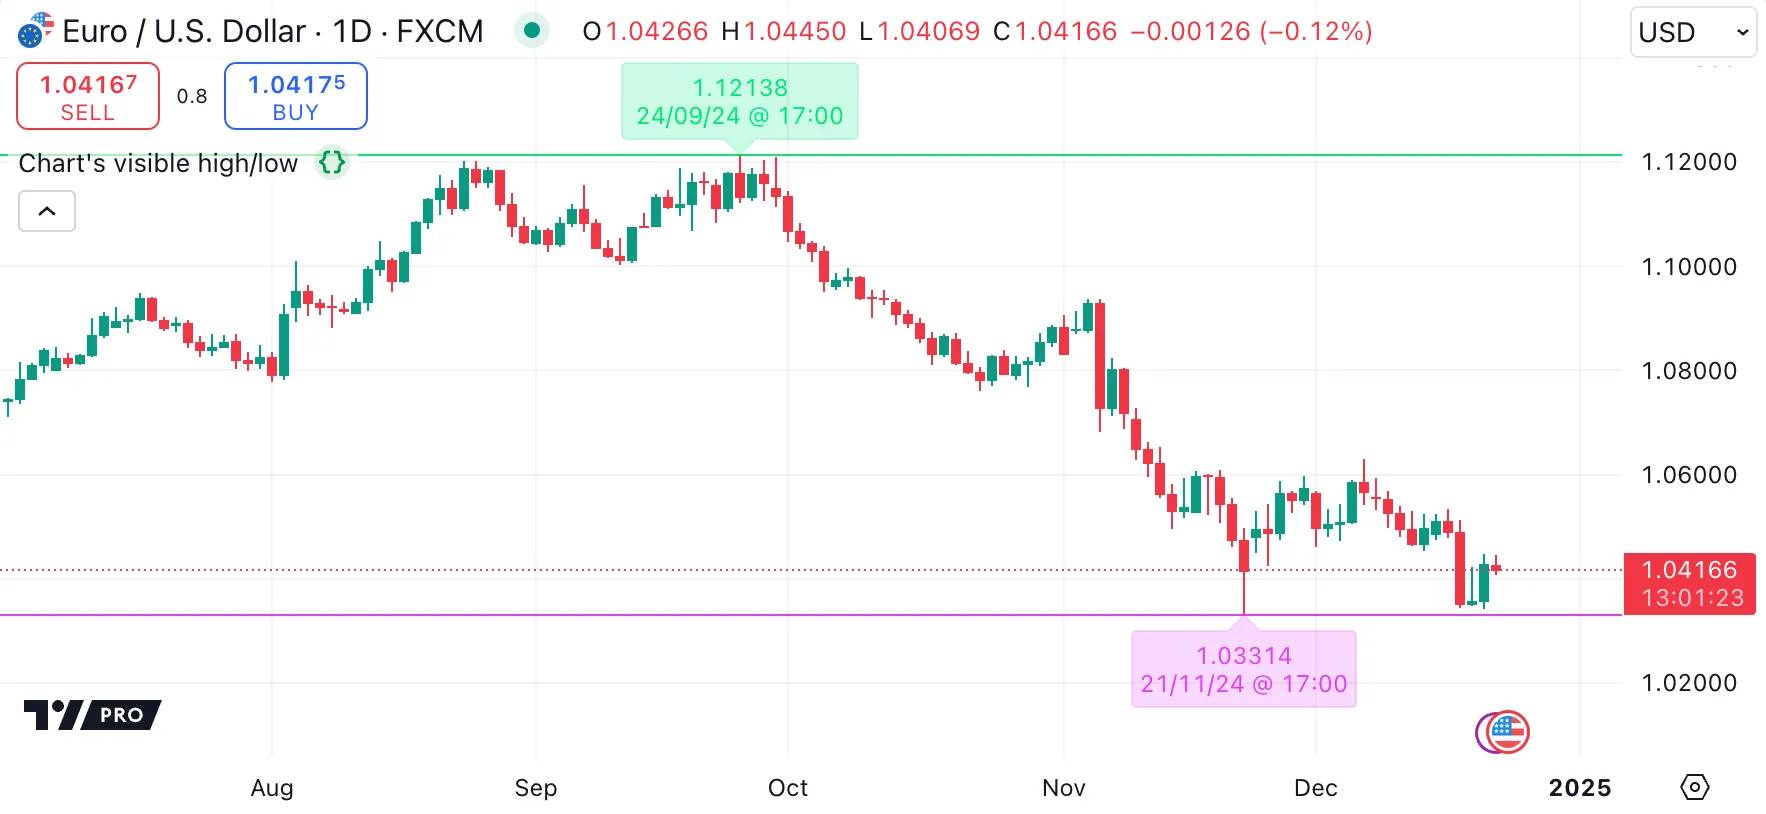
Note that:
- Values derived from visible chart variables can change throughout the script’s runtime. To accurately reflect the entire visible range, the script defers drawing the lines until the last bar (using barstate.islast).
- Because the visible chart values are defined in the global scope, outside the local block defined by barstate.islast, the functions process the entire dataset before determining the final high and low values.
For more information, refer to the VisibleChart library’s documentation.
How to remember the last time a condition occurred?
Scripts can store the number of bars between the current bar and a bar on which a condition occurred in various ways:
- Using ta.barssince(). This built-in function is the simplest way to track the distance from the condition.
- Manually replicating the functionality of ta.barssince() by initializing the distance to zero when the condition occurs, then incrementing it by one on each bar, resetting it if the condition occurs again.
- Saving the bar_index when the condition occurs, and calculating the difference from the current bar_index.
Programmers can then use the number of bars with the history-referencing operator [] to retrieve the value of a variable, such as the close, on that bar.
Alternatively, if the script needs only the value itself and not the number of bars, simply save the value each time the condition occurs. This method is more efficient because it avoids referencing the series multiple times throughout its history. This method also reduces the risk of runtime errors in scripts if the size of the historical reference is too large.
Here’s a script that demonstrates these methods:
How can I plot the previous and current day’s open?
There are several methods for plotting prices from a higher timeframe (we assume that these scripts are to be run on intraday timeframes).
Using timeframe.change()
The timeframe.change() function identifies when a bar in a specified timeframe opens. When a new daily bar opens, the following example script first copies the existing daily opening value to the variable for the previous day, and then updates the opening price for the current day.
Note that:
- This method uses the chart’s timeframe transitions to establish open prices and does not make adjustments for session times.
- For some markets and instrument types, the intraday data and the daily data is expected to differ. For example, the US exchanges like NASDAQ and NYSE include more trades in daily bars than in intraday ones, which results in different OHLC values between intraday and daily data, and in daily volume being far greater than intraday one. As a result, the first open of a trading session on an intraday chart can differ from the open of its respective 1D candle.
Using request.security()
To match the values on the chart with the values on higher timeframe charts, it’s necessary to access the higher timeframe data feeds. Scripts can achieve this by using the request.security() function.
The following example script requests two data feeds from a higher timeframe. To reduce the risk of repainting, we use only confirmed values for historical bars. The script plots confirmed values retroactively on each preceding day when a new day begins. For the real-time bar of the higher timeframe, which represents the current day, we draw a separate set of lines. The realtime lines can change during the day. While this type of repainting is not apparent here when using the opening price, which does not change after the bar opens, it is more obvious for scripts that use the closing price, which takes the current price until the bar closes.
Using timeframe
Instead of writing custom logic to retrieve or calculate prices for a particular timeframe, programmers can run the entire script in that timeframe.
If scripts include the timeframe parameter in the indicator declaration, the user can choose the timeframe in which the script runs. The script can set a default timeframe.
By default, the following script plots the current and previous day’s opening prices, similar to the previous examples. It is much simpler, but behaves quite differently. For historical bars, the script returns values when the day closes, effectively one day “late”. For realtime and elapsed realtime bars, the script returns live values, if the option “Wait for timeframe closes” is not selected in the script settings.
Note that:
- Only simple scripts that do not use drawings can use the
timeframeparameter. - Scripts that use the
timeframeparameter can plot values quite differently depending on which settings are chosen. For an explanation, see this Help Center article.
How can I count the occurrences of a condition in the last x bars?
One obvious method is to use a for loop to retrospectively review each of the last x bars and check for the condition. However, this method is inefficient, because it examines all bars in range again on every bar, even though it already examined all but the last bar.
In general, using unnecessary, large, or nested for loops can result in slower processing and longer chart loading times.
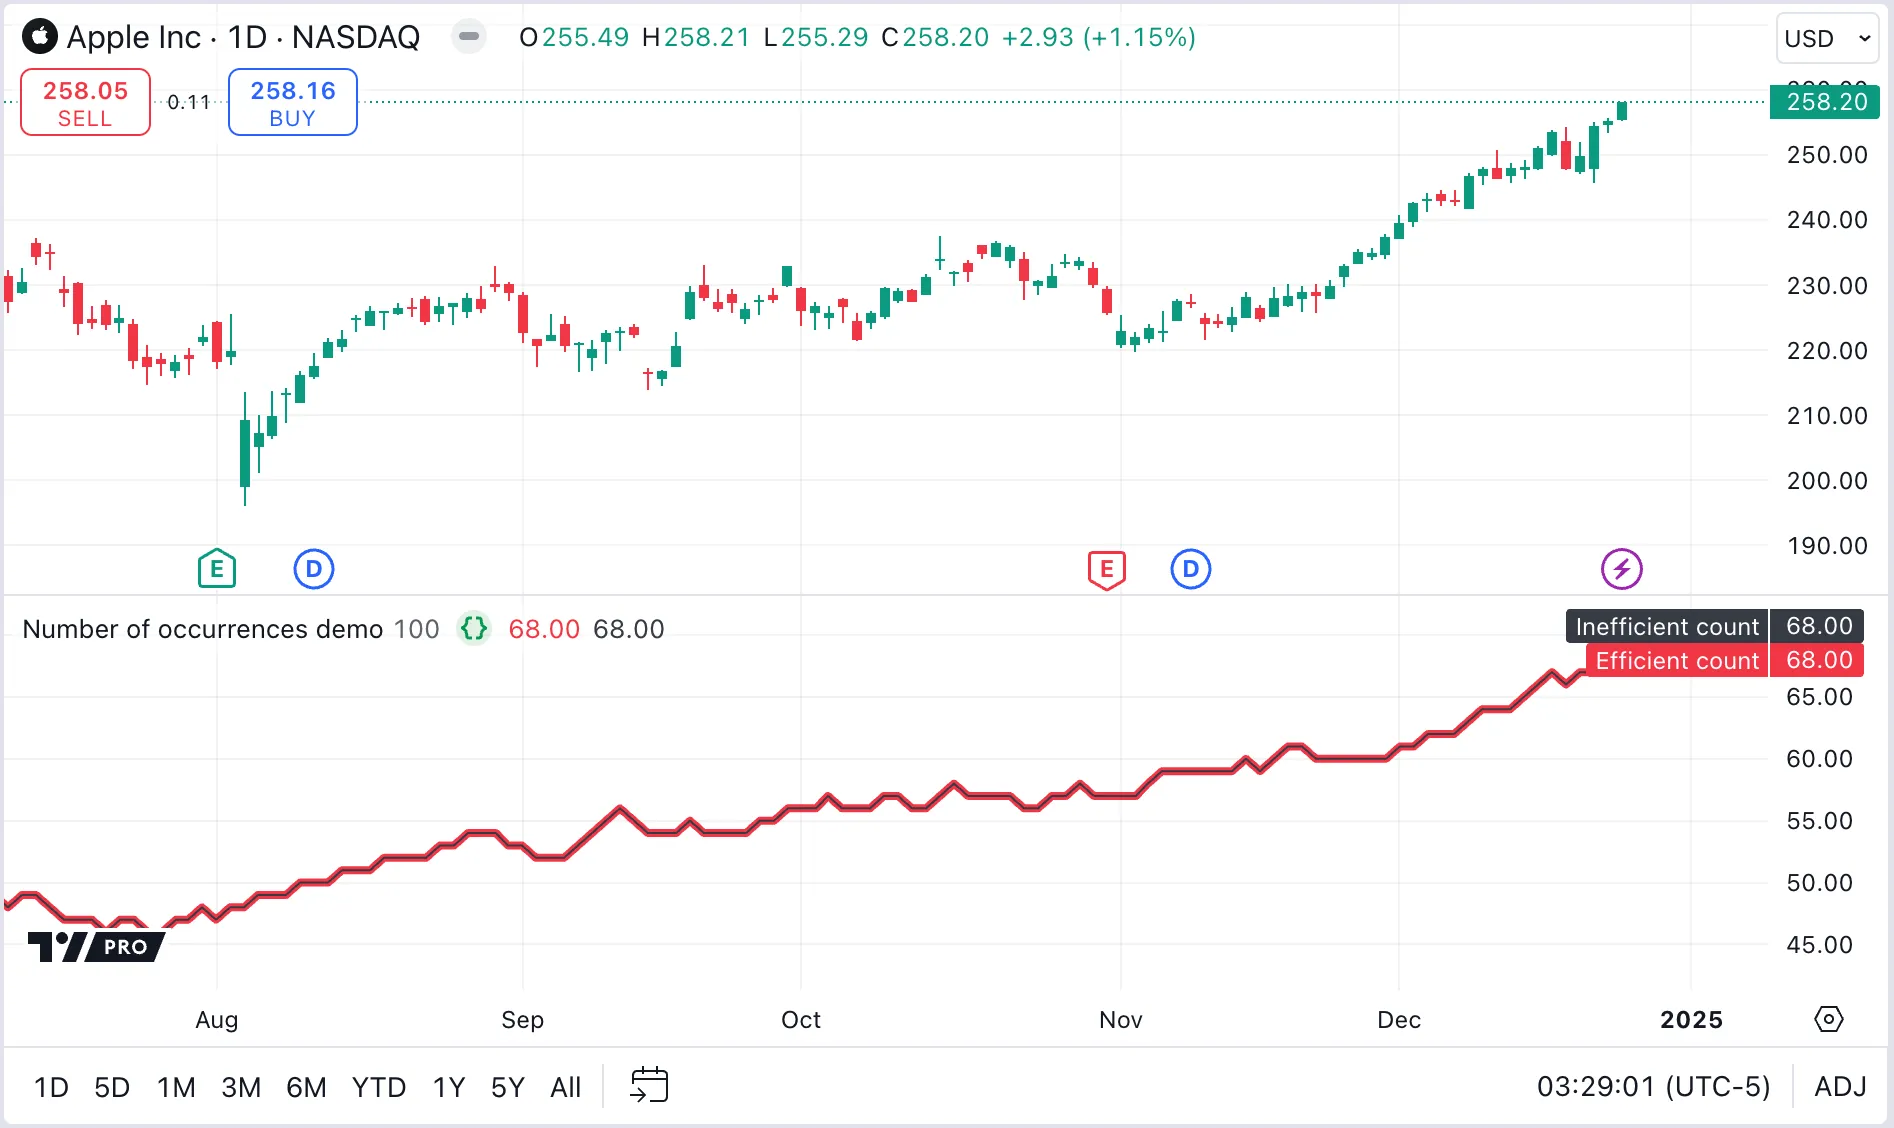
The simplest and most efficient method is to use the built-in math.sum() function, and pass it a conditional series to count. This function maintains a running total of the count as each bar is processed, and can take a simple or series length.
The following example script uses both of these calculation methods. It also uses a series length that adjusts for the first part of the chart, where the number of bars available is less than the length. This way, the functions do not return na values.
How can I implement an on/off switch?
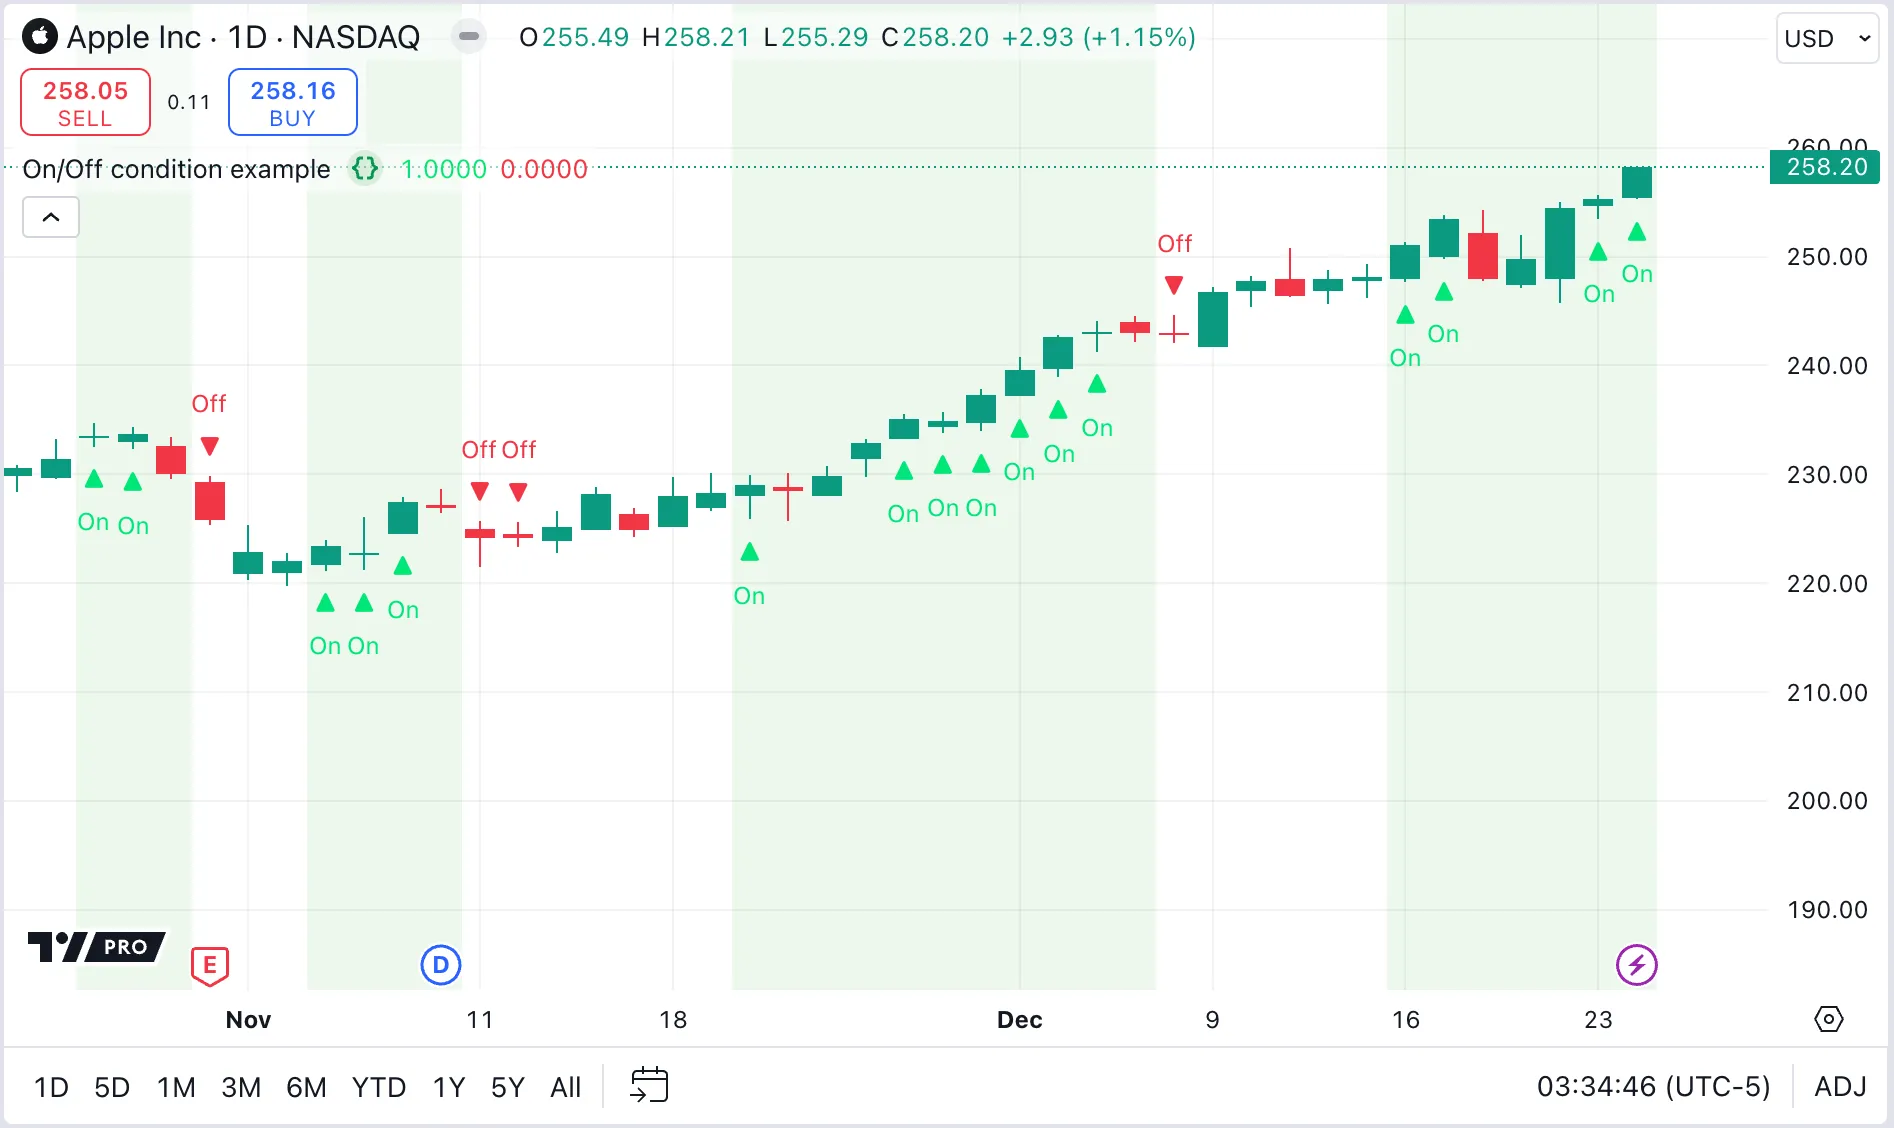
An on/off switch is a persistent state that can be turned on once, and persists across bars until it is turned off. Scripts can use the var keyword to initialize a variable only once, and maintain its most recent value across subsequent bars unless it is reassigned. Such persistent states can be boolean values, or integers, or any other type.
The following example script show how to implement this. Each instance of the on and off triggers displays with an arrow and the word “On” or “Off”. A green background highlights the bars where the switch is in the “On” state.
How can I alternate conditions?
Scripts can alternate from one state to another strictly, even when the triggers to change state do not occur in strict order. This can be useful to mark only the first trigger and not any subsequent triggers, or to prevent multiple alerts.
The following example script plots all pivots, defined by Williams fractals. These pivots can occur in any order. The script stores the type of the most recent pivot, and confirms the next pivot only if it is of the opposite type, such that confirmed pivots appear strictly high-low-high or low-high-low, etc. Confirmed pivots are plotted in a larger size and different color. The chart background color is colored according to the type of the most recent confirmed pivot.
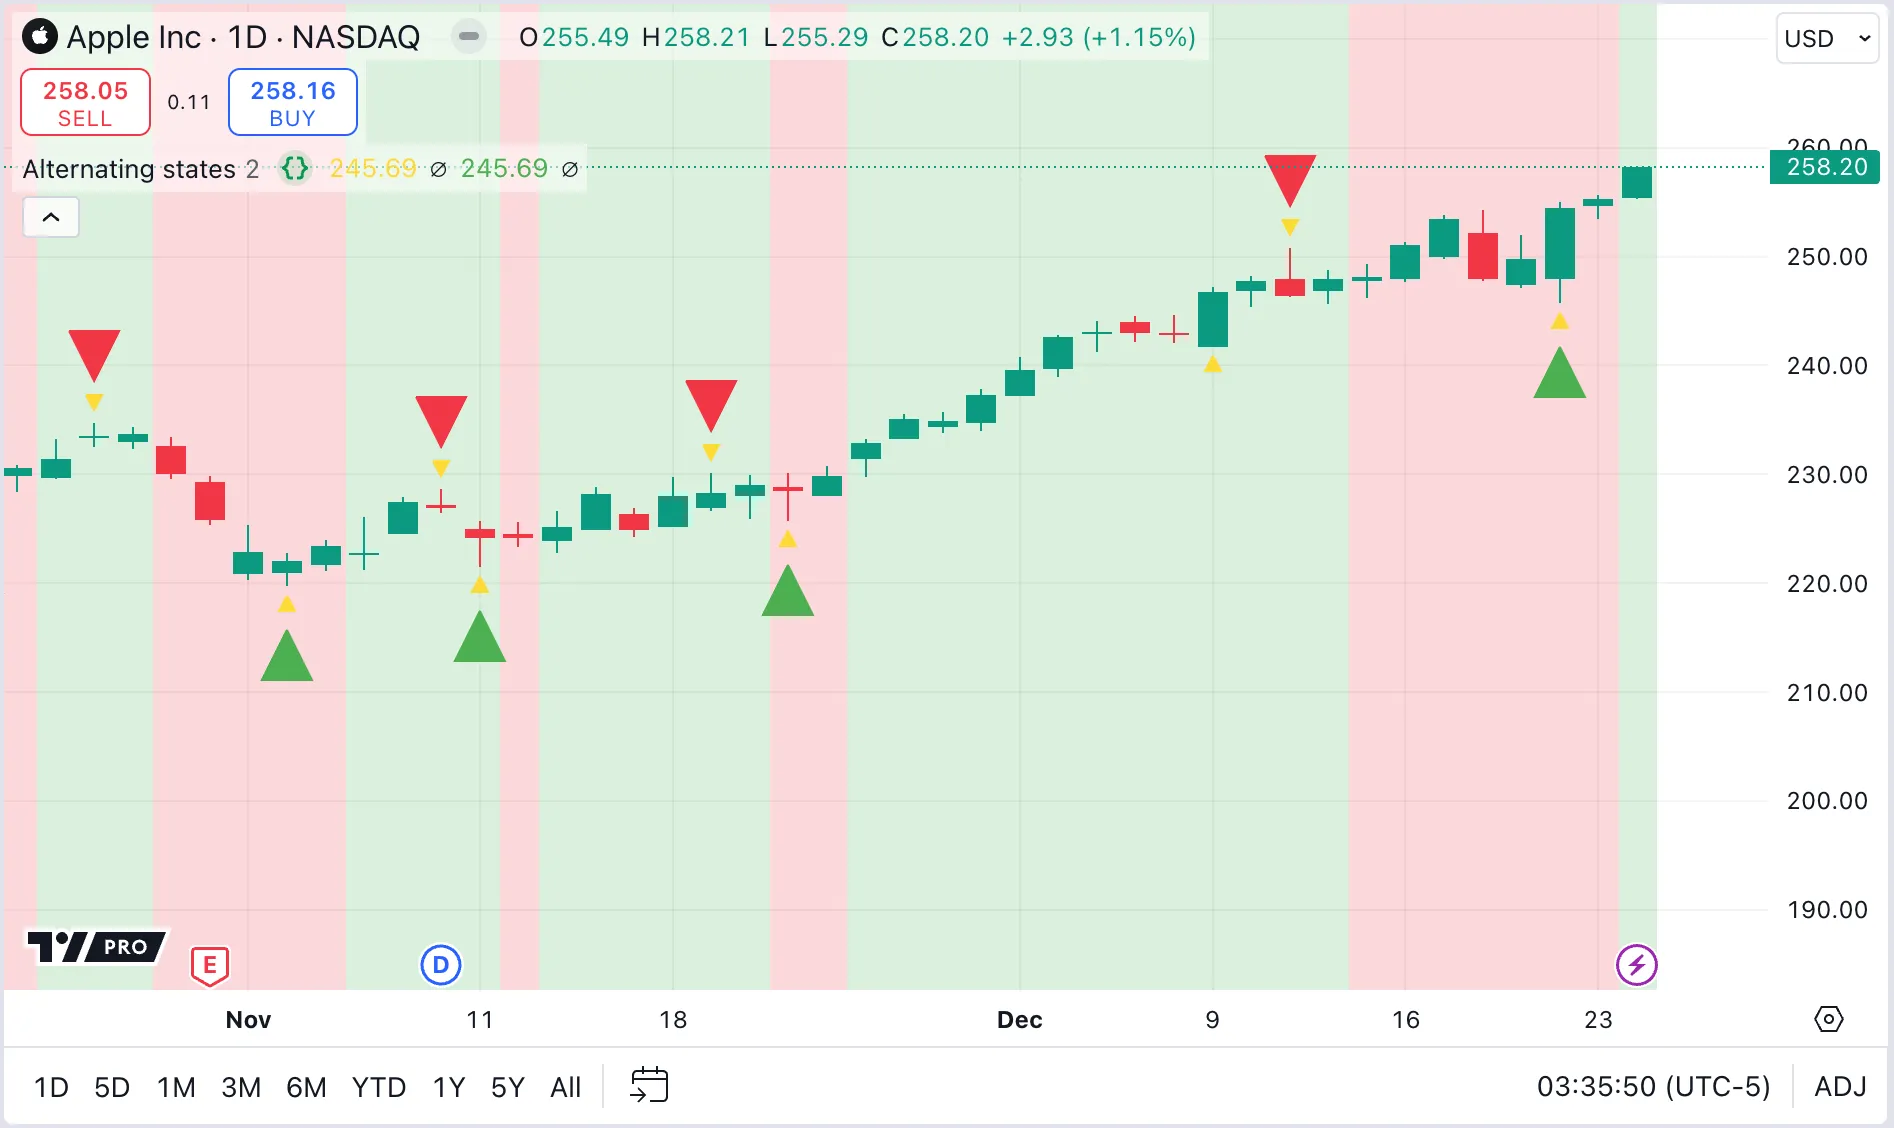
Note that:
- The script uses an enum variable with three possible values to store the type of the last pivot and to decide whether to confirm subsequent pivots.
- A single boolean value cannot reliably do this, because boolean values can only be
trueorfalseand notna. Using a boolean value can cause unexpected behavior, for example, at the beginning of the chart history where no trigger condition has occurred. - A pair of boolean variables can replicate this behavior, with careful handling. See the FAQ entry “How can I accumulate a value for two exclusive states?” for an example of using two boolean values in this way.
- A string variable can also do the same thing. The advantage of an enum over a string is that all possible allowed values are known, thus avoiding the case where a condition tests for a value that is misspelled, outdated or otherwise not relevant. Such a test silently fails in every possible case, and the corresponding logic never runs. Such tests can therefore cause bugs that are difficult to find.
Can I merge two or more indicators into one?
It is possible to combine indicators, paying attention to the following points:
- Ensure that the scales that the indicators use are compatible, or re-scale them to be compatible. For example, combining a moving average indicator, designed to overlay the bar chart, with a volume bar indicator that’s meant for a separate indicator pane is unlikely to display as expected.
- Check that variable names do not overlap.
- Convert each script to the most recent version of Pine Script®, or at least the same version, before combining them.
- Ensure that there is only one version declaration and script declaration in the resulting script.
How can I rescale an indicator from one scale to another?
Rescaling an indicator from one scale to another means trying to ensure that the values display within a similar range to other values, from the same indicator or from the chart.
For example, consider a script that displays volume typically measuring in the millions of units, and also RSI, which ranges from zero to one hundred. If the script displays these values in the same pane, the volume is visible but the RSI will be so small as to be unreadable.
Where values are dissimilar like this, they must be rescaled or normalized:
- If the minimum and maximum possible values are known, or bounded, the values can be rescaled, that is, adjusted to a new range bounded by different maximum and minimum values. Each value differs in absolute terms, but retains the same relative proportion to other rescaled values.
- If the values are unbounded, meaning that either the maximum or minimum values, or both, are not known, they must instead be normalized. Normalizing means scaling the values relative to historical maximum and minimum values. Because the maximum and minimum historical values can change over time as the script runs on more historical and realtime bars, the new scale is dynamic and therefore the new values are not exactly proportional to each other.
The example script below uses a rescale() function to rescale RSI values, and a normalize() function to normalize Commodity Channel Index (CCI) and volume values. Although normalizing is an imperfect solution, it is more complete than using ta.lowest() and ta.highest(), because it uses the minimum and maximum values for the complete set of elapsed bars instead of a subset of fixed length.
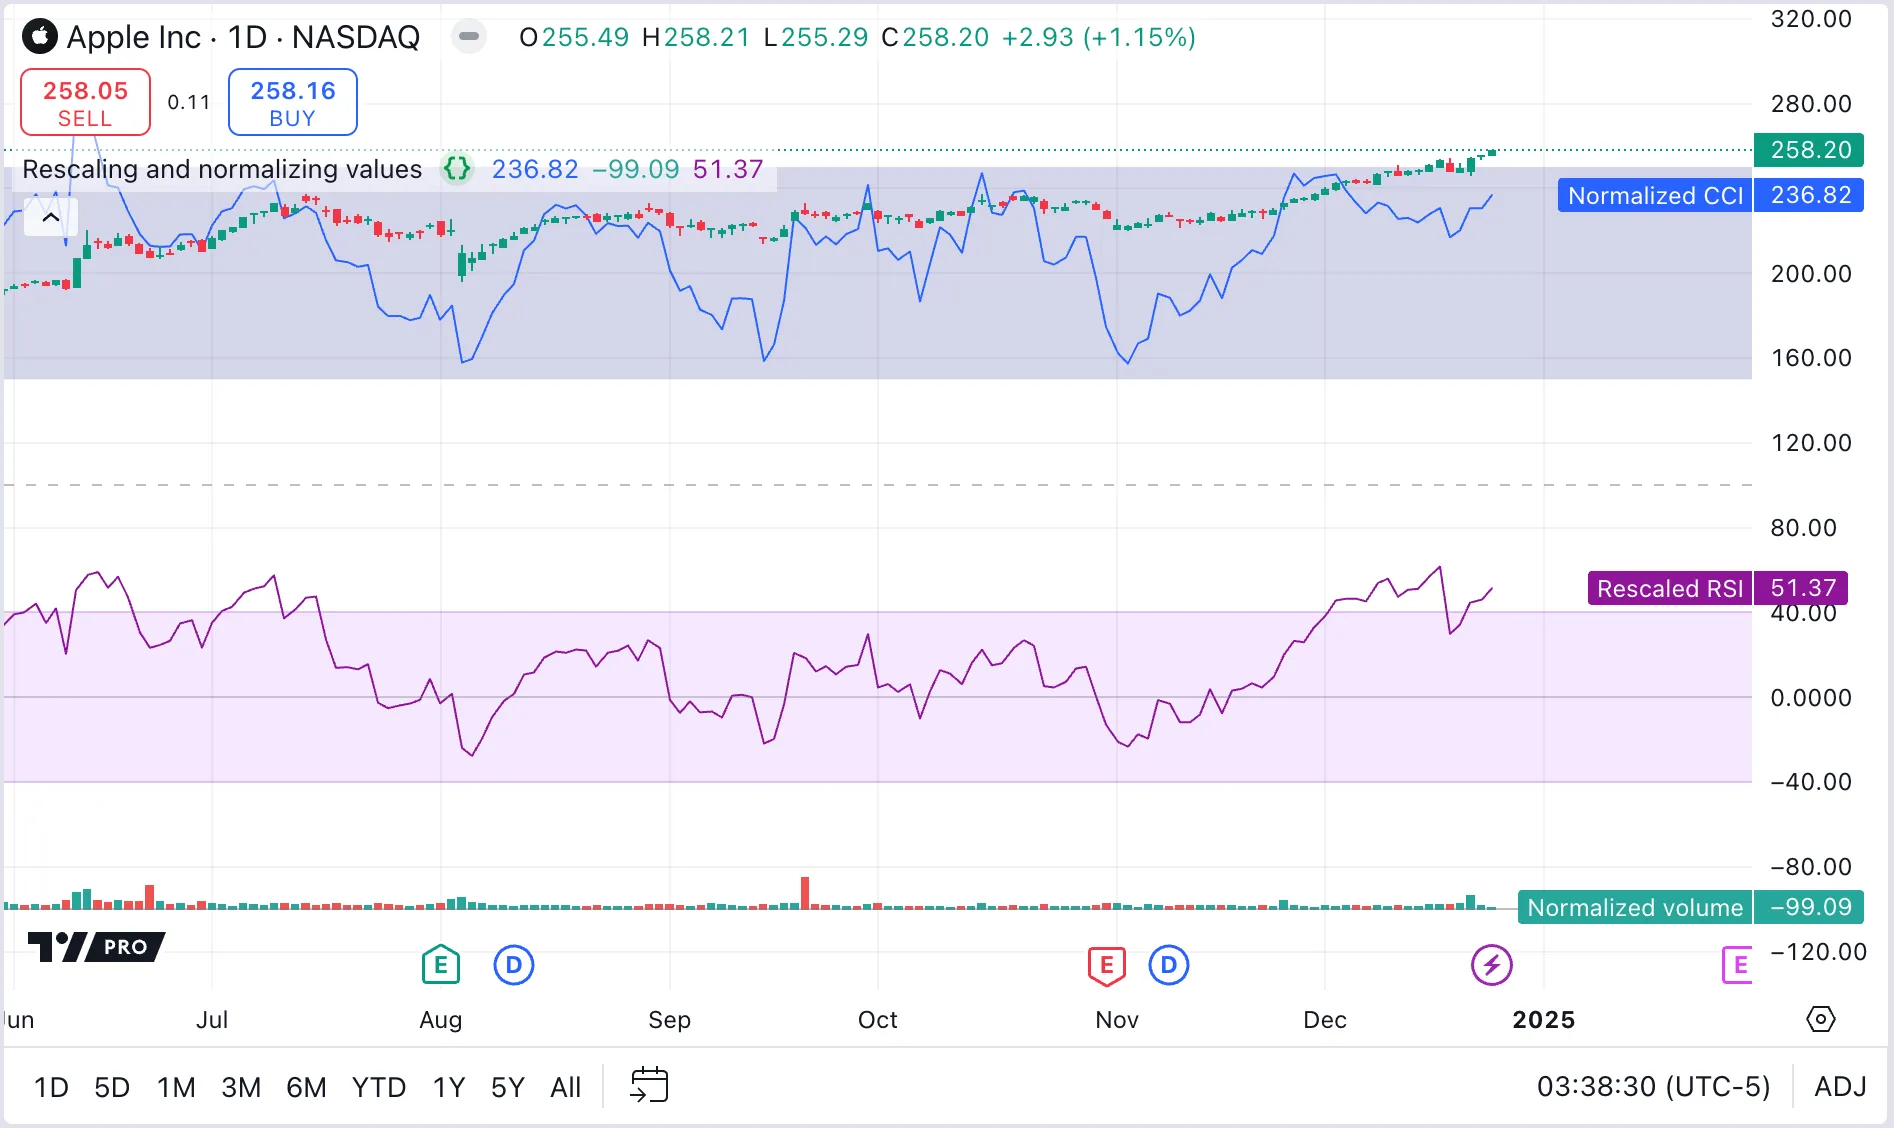
How can I calculate my script’s run time?
Programmers can measure the time that a script takes to run and see detailed information about which parts of the code take longest in the Pine Profiler. See the section of the User Manual on Profiling and optimization for more information.
How can I save a value when an event occurs?
To save a value when an event occurs, use a persistent variable. Scripts declare persistent variables by using the var keyword. Such variables are initialized only once, at bar_index zero, instead of on each bar, and maintain the same value after that unless changed.
In the following example script, the var keyword allows the priceAtCross variable to maintain its value between bars until a crossover event occurs, when the script updates the variable with the current close price. The := reassignment operator ensures that the global variable priceAtCross is modified. Using the = assignment operator instead would create a new local variable that is inaccessible outside the if block. The new local variable would have the same name as the global variable, which is called shadowing. The compiler warns about shadow variables.
How can I count touches of a specific level?
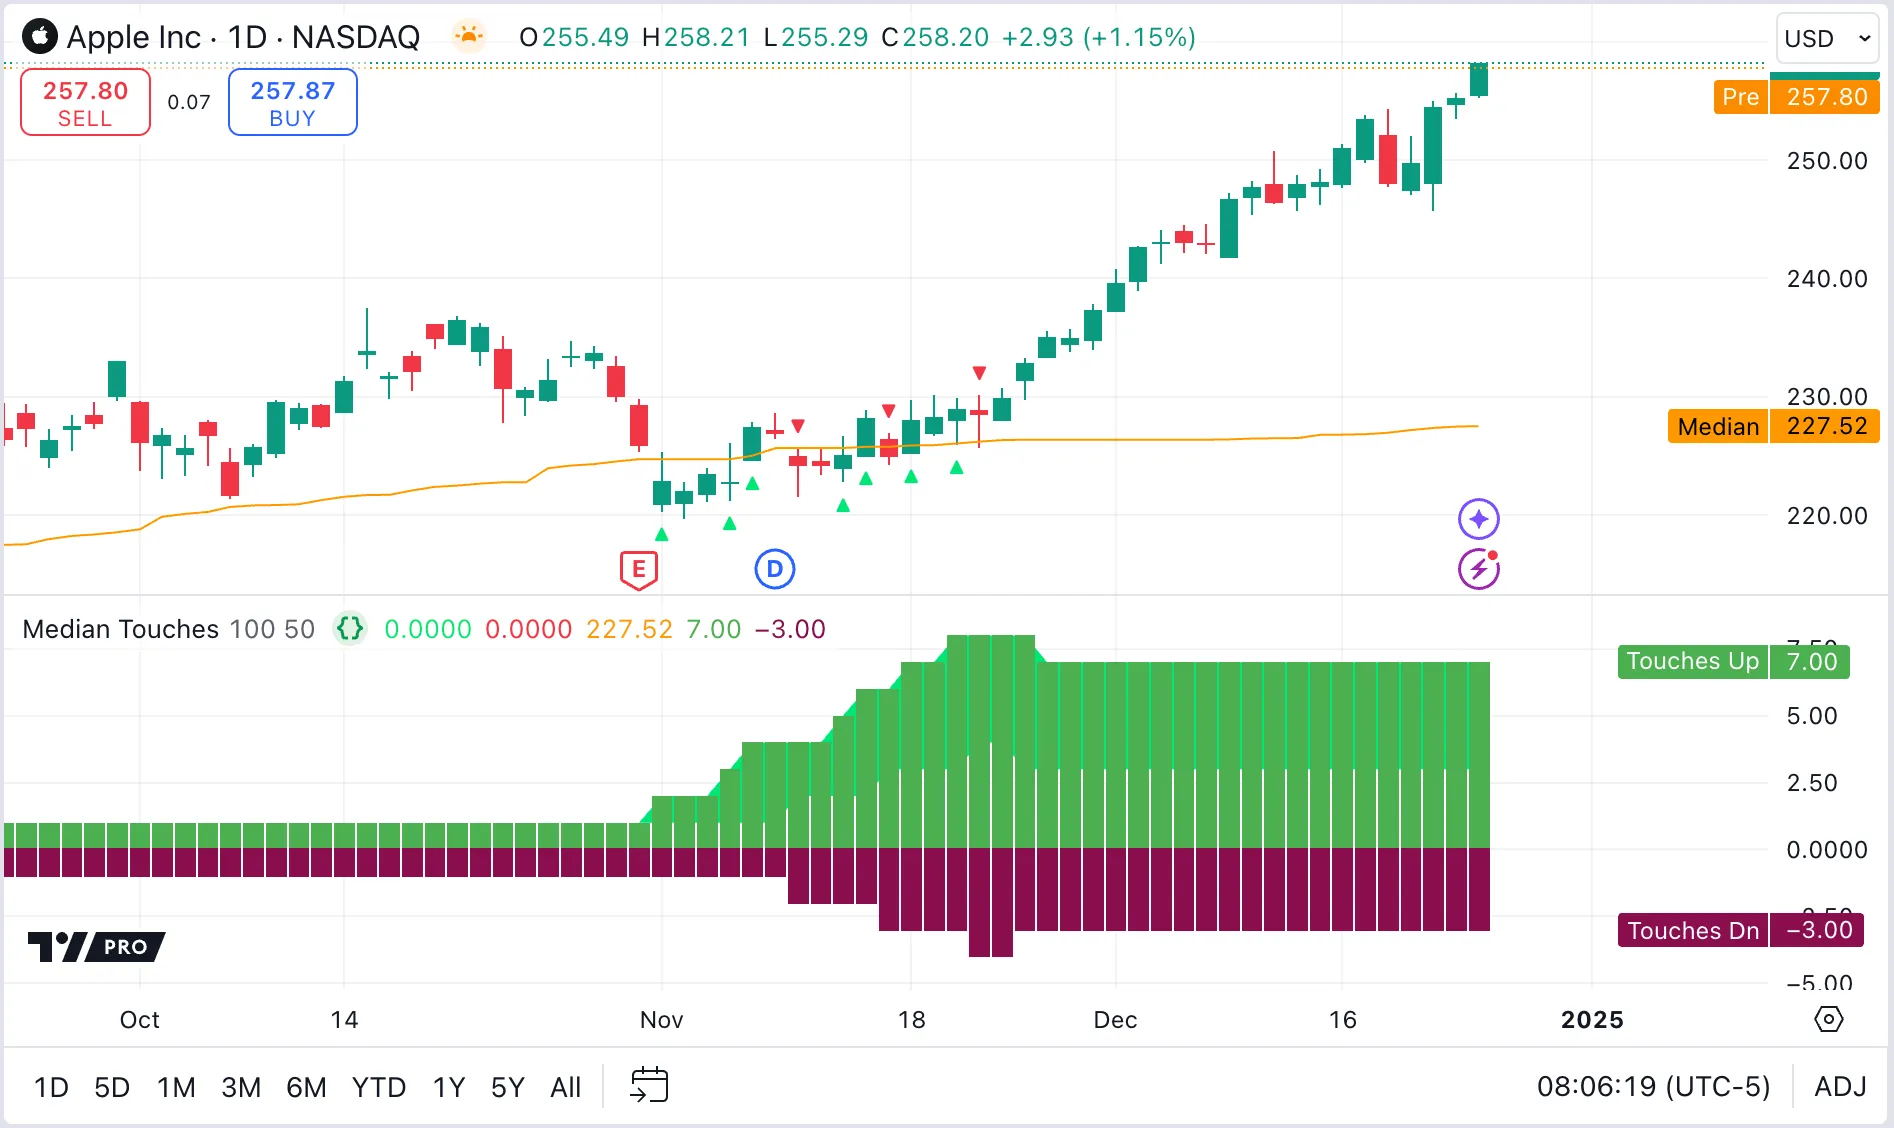
The most efficient way to count touches of a specific level is by tracking the series on each bar. A robust approach requires maintaining separate tallies for up and down bar touches and taking into account any gaps across the level. Using loops instead would be inefficient and impractical in this case.
The following example script records a value of 1 in a series whenever a touch occurs, and uses the math.sum() function to count these instances within the last touchesLengthInput bars. This script displays the median and touches on the chart using the force_overlay parameter of the plot*() functions, and displays the count in a separate pane.
How can I know if something is happening for the first time since the beginning of the day?
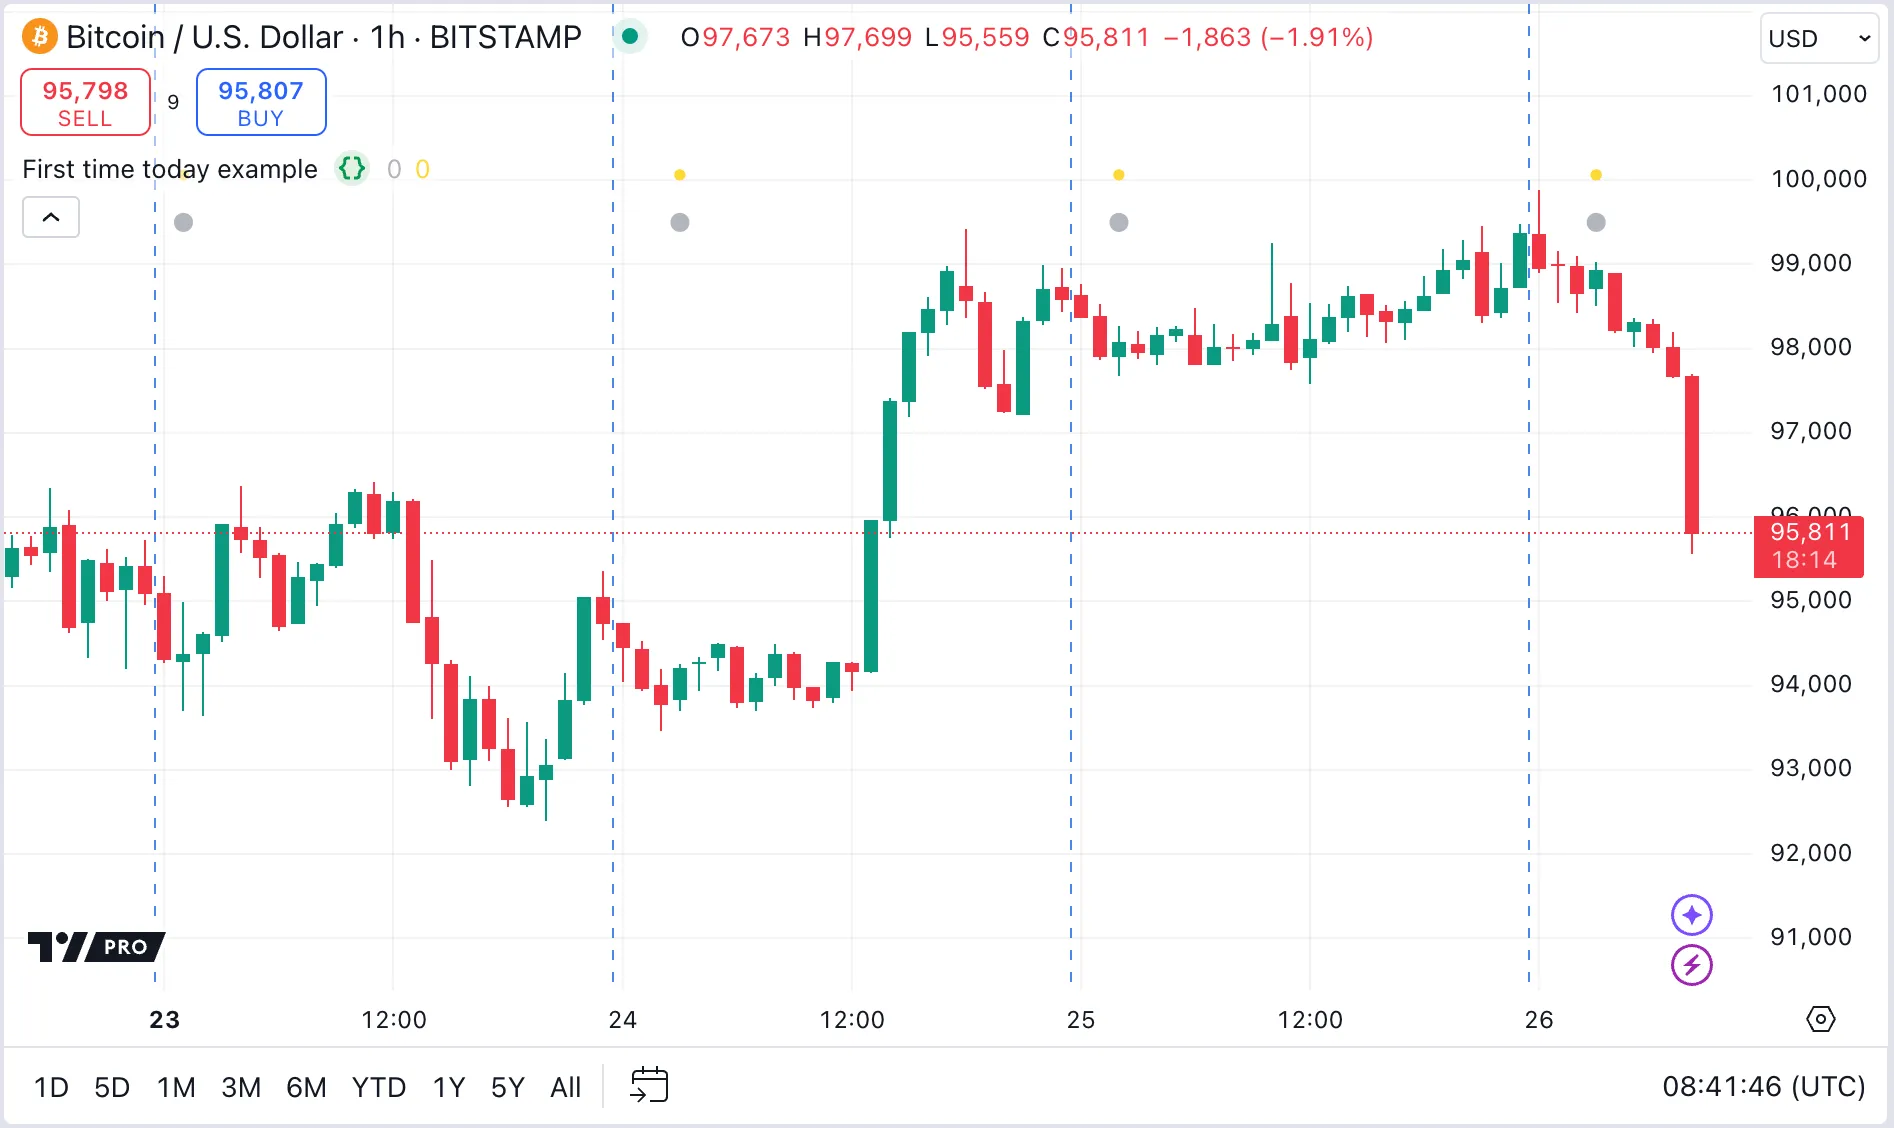
One way is to use the ta.barssince() function to check if the number of bars since the last occurrence of a condition, plus one, is greater than the number of bars since the beginning of the new day.
Another method is to use a persistent state to decide whether an event can happen. When the timeframe changes to a new day, the state is reset to allow the event. If the condition occurs while the state allows it, an event triggers. When the event triggers, the state is set so so as not to allow the event.
The following example script shows both methods.
How can I optimize Pine Script code?
Optimizing Pine Script code can make scripts run faster and use less memory. For large or complex scripts, optimization can avoid scripts reaching the computational limits.
The Pine Profiler analyzes all significant code in a script and displays how long each line or block takes to run. Before optimizing code, run the Pine Profiler to identify which parts of the code to optimize first. The Pine Profiler section of the User Guide contains an extensive discussion of how to optimize code. In addition, consider the following tips:
- Use strategy scripts only to model trades. Otherwise, use indicator scripts, which are faster.
- Become familiar with the Pine execution model and time series to structure code effectively.
- Declare variables with the var keyword when initialization involves time-consuming operations like complex functions, arrays, objects, or string manipulations.
- Keep operations on strings to a necessary minimum, because they can be more resource-intensive than operations on other types.
- Using built-in functions is usually faster than writing custom functions that do the same thing. Sometimes, alternative logic can be more efficient than using standard functions. For example, use a persistent variable when an event occurs, to avoid using ta.valuewhen(), as described in the FAQ entry How can I save a value when an event occurs?. Or save the bar_index when a condition occurs to avoid using ta.barssince(), as described in the FAQ entry How to remember the last time a condition occurred?.
How can I access a stock’s financial information?
In Pine, the request.financial() function can directly request financial data.
On the chart, users can open financial indicators in the “Financials” section of the “Indicators, Metrics & Strategies” window.
How can I find the maximum value in a set of events?
Finding the maximum value of a variable that has a meaningful value on every bar, such as the high or low in price, is simple, using the ta.highest() function.
However, if the values do not occur on every bar, we must instead store each value when it occurs and then find the maximum. The most flexible way to do this is by using an array.
The following example script stores pivot highs in a fixed-length array. The array is managed as a queue: the script adds new pivots to the end, and removes the oldest element from the array. To identify the highest value among the stored pivots, we use the array.max() function and plot this maximum value on the chart. Additionally, we place markers on the chart to indicate when the pivots are detected, and the bars where the pivots occurred. By definition, these points are not the same, because a pivot is only confirmed after a certain number of bars have elapsed.
How can I display plot values in the chart’s scale?
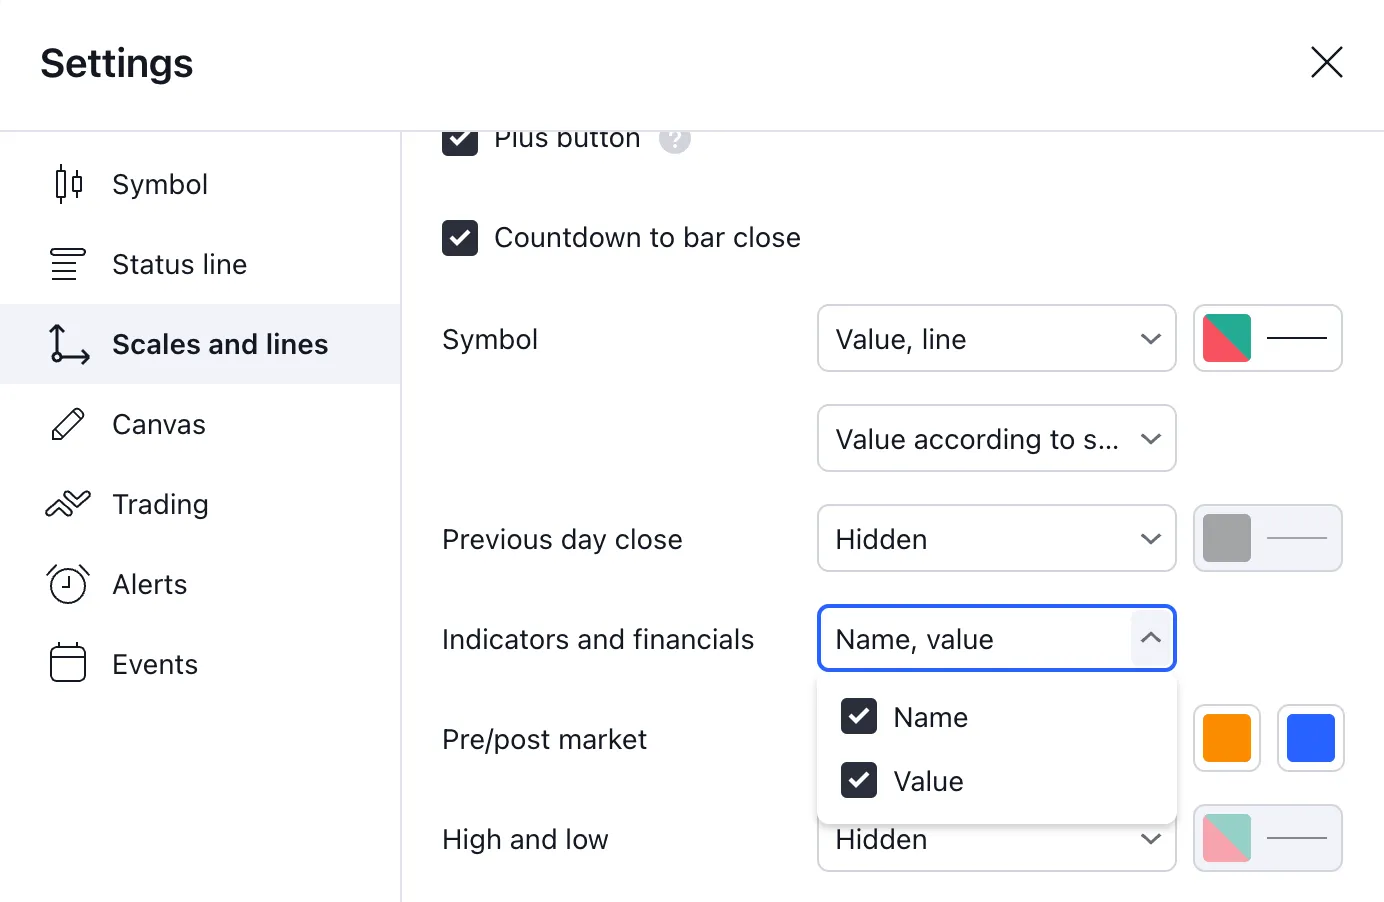
To display the names and values of plots from an indicator in the chart’s scale, right-click on the chart to open the chart “Settings” menu. In the “Scales and lines” tab, select “Name” and “Value” from the “Indicators and financials” drop-down menu.
How can I reset a sum on a condition?
To sum a series of values, initialize a persistent variable by using the var keyword to the track the sum. Then use a logical test to reset the values when a condition occurs.
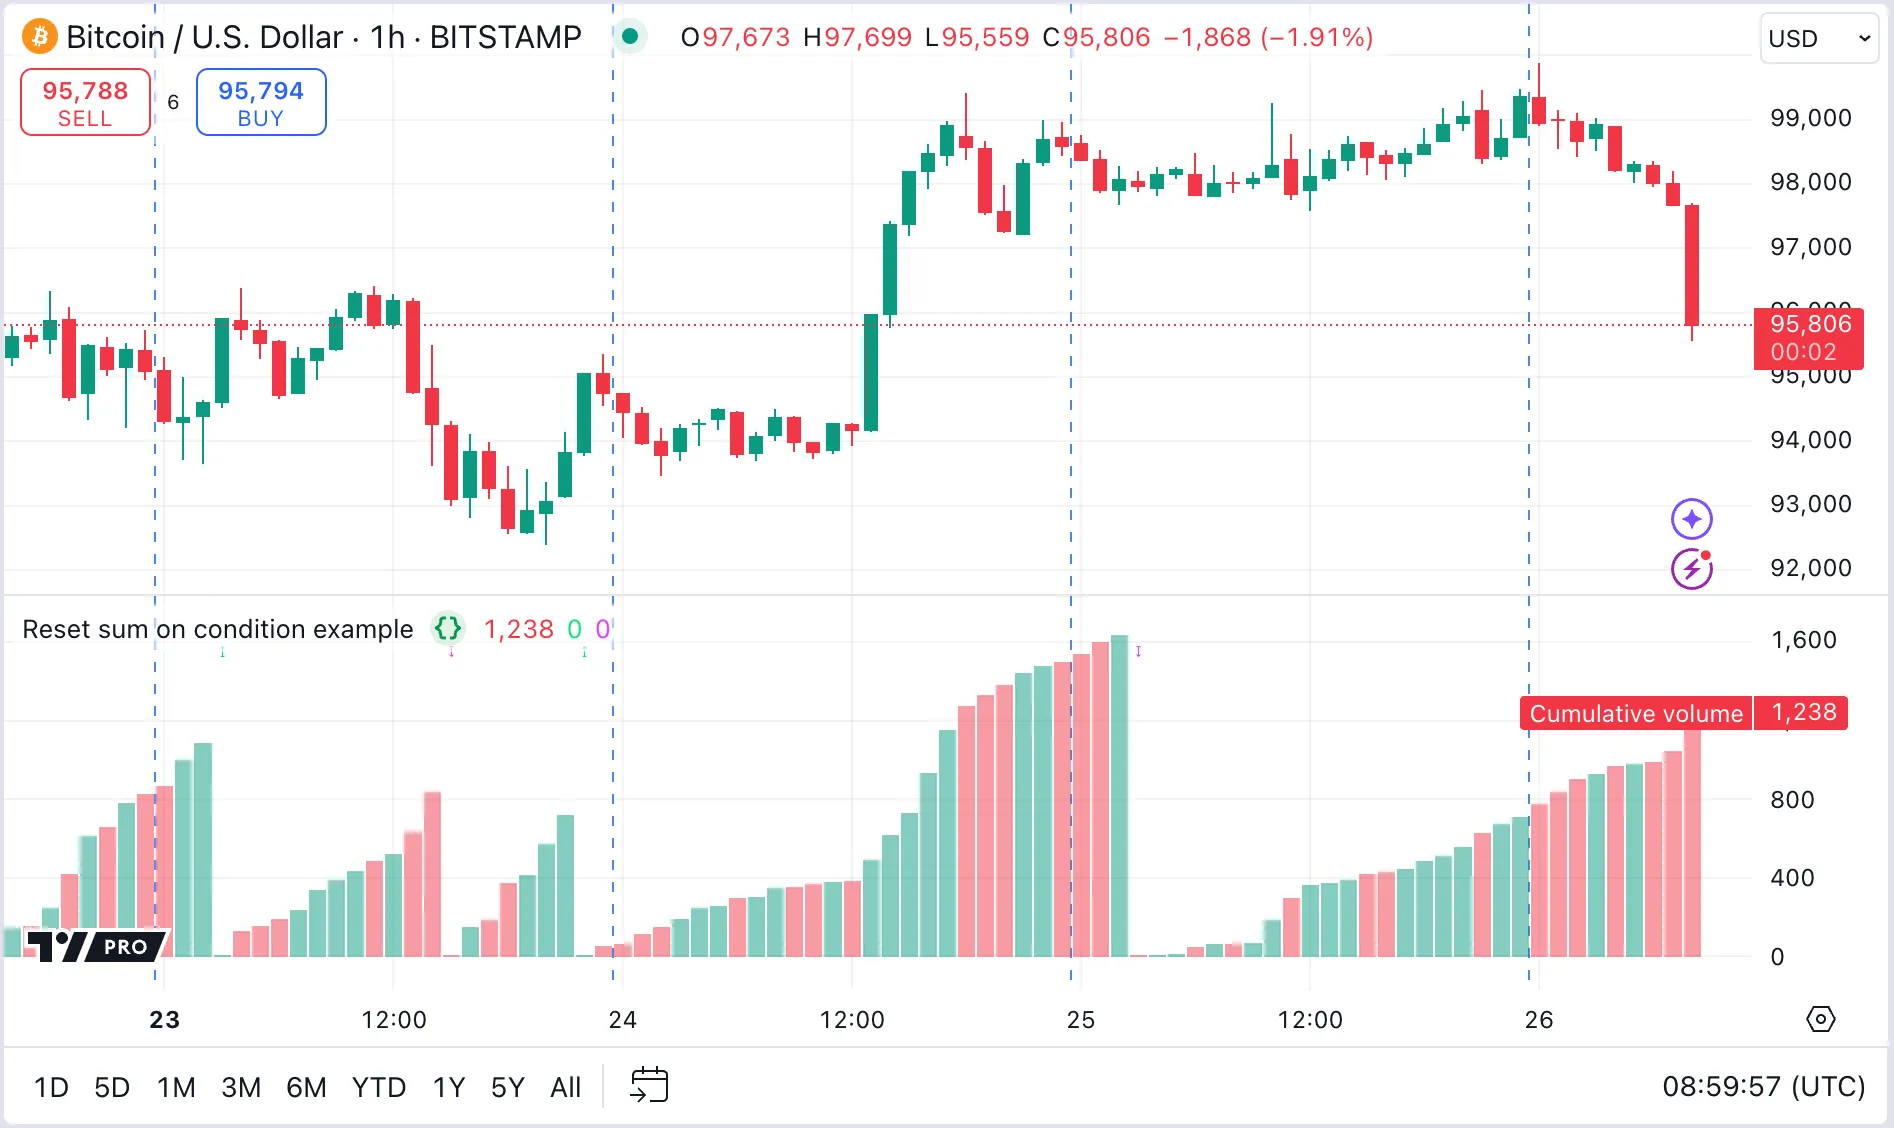
In the following example script, we initialize a persistent variable called cumulativeVolume to track the sum of the volume. Then we reset it to zero on a Moving Average Convergence/Divergence (MACD) cross up or down.
We plot the cumulative volume on the chart, as well as arrows to show the MACD crosses.
Note that:
- In the ta.macd() function call, we only require two of the three values returned in the tuple. To avoid unnecessary variable declarations, we assign the third tuple value to an underscore. Here, the underscore acts like a dummy variable.
How can I accumulate a value for two exclusive states?
Consider a simple indicator defined by two exclusive states: buy and sell. The indicator cannot be in both buy and sell states simultaneously. In the buy state, the script accumulates the volume of shares being traded. In the sell state, the accumulation of volume begins again from zero.
There are different ways to code this kind of logic. See the FAQ entry “How can I alternate conditions” for an example of using an enum to manage two exclusive states. The following example script uses two boolean variables to do the same thing.
Additionally, this script demonstrates the concept of events and states. An event is a condition that occurs on one or more arbitrary bars. A state is a condition that persists over time. Typically, programmers use events to turn states on and off. In turn, states can allow or prevent other processing.
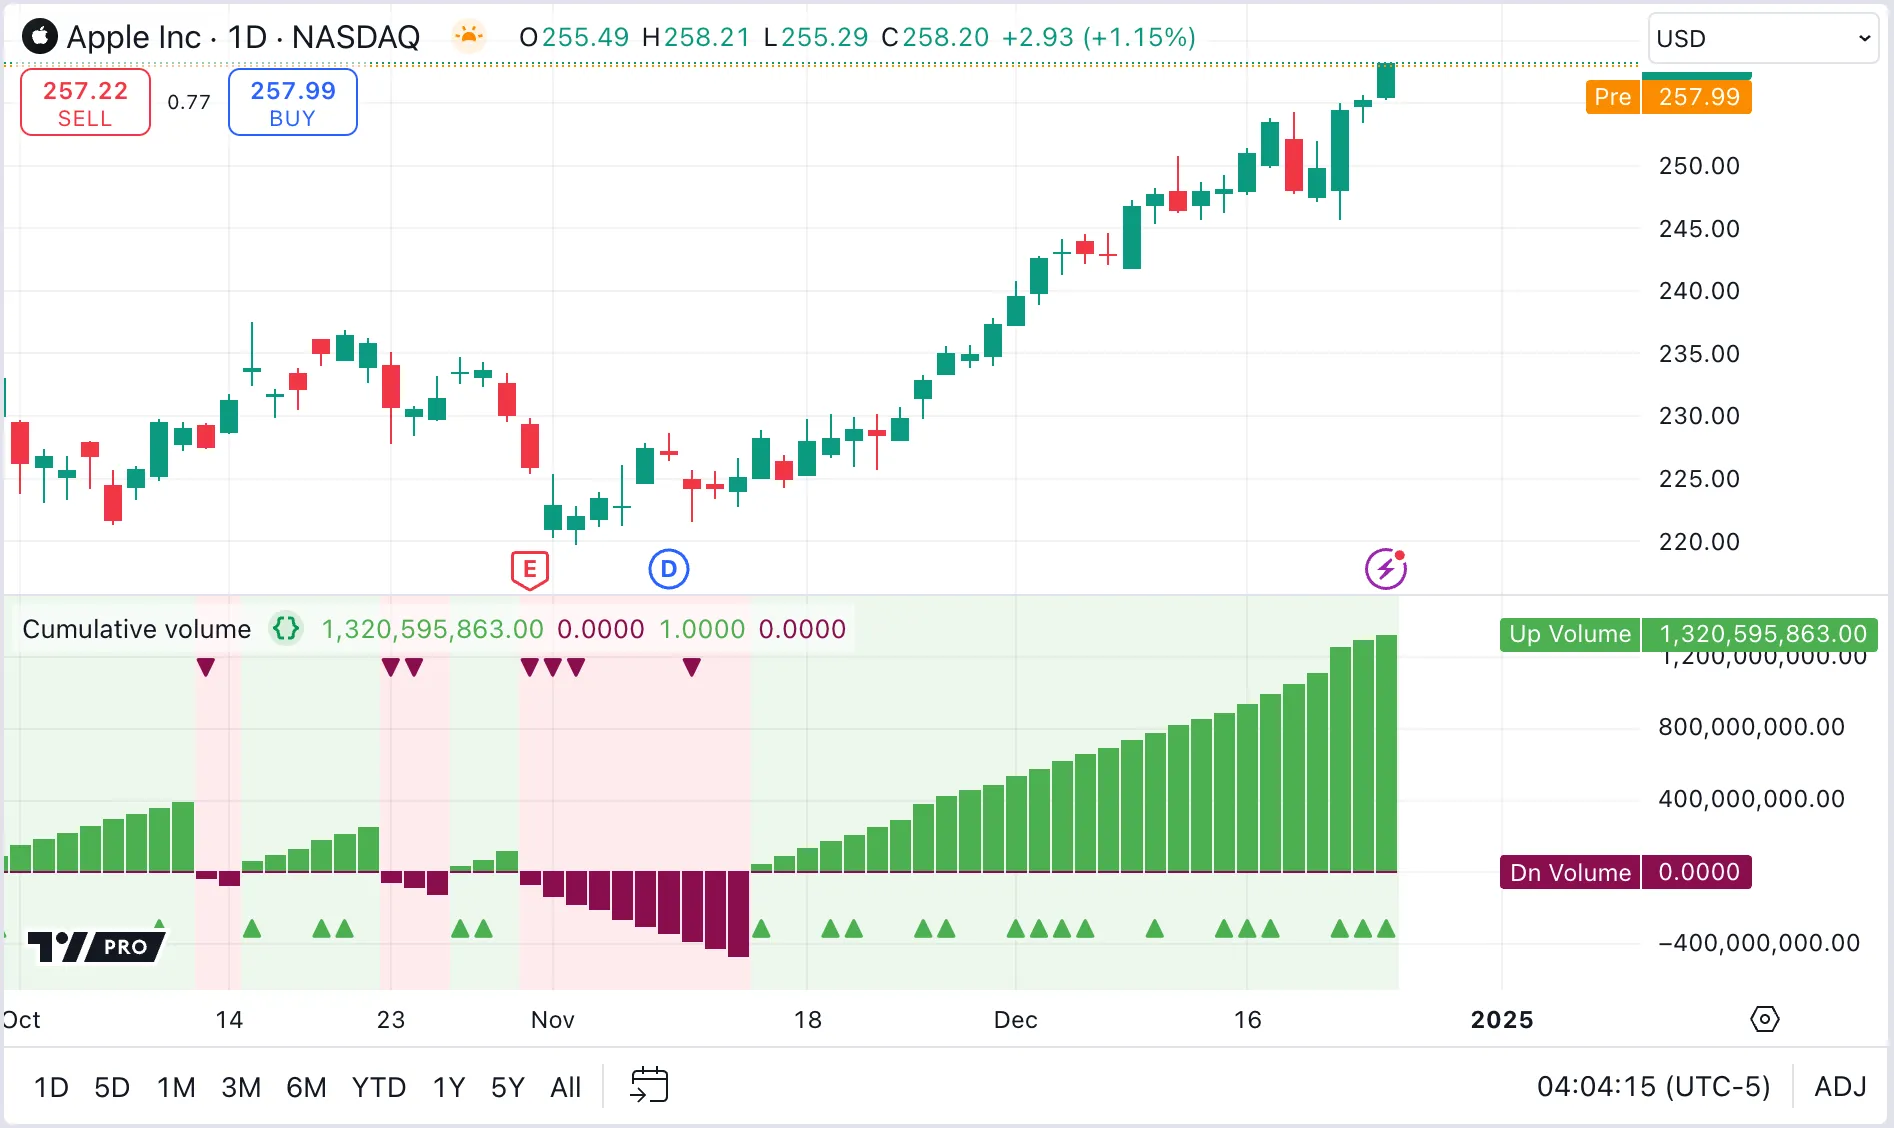
The script plots arrows for events, which are based on rising or falling values of the close price. These events determine which of the two exclusive states is active; the script colors the background according to the current state. The script accumulates bullish and bearish volume only in the corresponding bullish or bearish state, displaying it in a Weis Wave fashion.
Note that:
- Equivalent logic using ternary conditions is smaller and potentially more efficient, but not as easy to read, extend, or debug. This more verbose logic illustrates the concepts of events and states, which can apply to many types of scripting problems. This logic is an extension of the on-off switch in the FAQ entry “How can I implement an on/off switch?“.
- When using states, it is important to make the conditions for resetting states explicit, to avoid unforeseen problems.
- Displaying all events and states during script development, either on the chart or in the Data Window, helps debugging.
How can I organize my script’s inputs in the Settings/Inputs tab?
A script’s plots and inputs constitute its user interface. The following example script uses the following techniques to organize inputs for greater clarity:
- Grouping inputs: Create a section header for a group of inputs by using the
groupparameter in the input() functions. Use constants for group names to simplify any potential name changes. - Visual boundaries: Use ASCII characters to create separators, establishing visual boundaries for distinct group sections. For continuous separator lines, reference group headers 1 and 2 in our script below, which use ASCII characters 205 or 196. Conversely, the dash (ASCII 45) and Em dash (ASCII 151), shown in group headers 3 and 4, do not join continuously, resulting in a less visually appealing distinction. Note that Unicode characters might display differently across different machines and browsers, potentially altering their appearance or spacing for various users.
- Indentation of sub-sections: For a hierarchical representation, use Unicode whitespace characters to indent input sub-sections. Group 3 in our script uses the Em space ( ) 8195 (0x2003) to give a tab-like spacing.
- Vertical alignment of inlined inputs: In our script, Group 1 shows how vertical alignment is difficult when inline inputs have varied
titlelengths. To counteract this misalignment, Group 2 uses the Unicode EN space ( ): 8194 (0x2002) for padding, since regular spaces are stripped from the label. For precise alignment, use different quantities and types of Unicode spaces. See here for a list of Unicode spaces of different widths. Note that, much like the separator characters, the rendering of these spaces might differ across browsers and machines. - Placing inputs on one line: Add multiple related inputs into a single line using the
inlineparameter. Group 4 in our script adds the title argument to just the first input and skips it for the others.
Tips:
- Order the inputs to prioritize user convenience rather than to reflect the order used in the script’s calculations.
- Never use two checkboxes for mutually exclusive selections. Use dropdown menus instead.
- Remember that dropdown menus can accommodate long strings.
- Provide adequate minimum and maximum values for numeric values, selecting the proper float or int type.
- Customize step values based on the specific needs of each input.
- Because checkboxes cannot be indented, use the input() function’s
optionsparameter to create dropdown selections so that the sections appear more organized compared to using checkboxes. - Observe how the
level3Inputis calculated as a boolean variable by comparing the input with theEQ1“ON” constant. This method provides a visually appealing indented on-off switch in the menu without adding complexity to the code. - For a consistent visual appearance, vertically center the separator titles across all inputs. Due to the proportional spacing of the font, achieving this might require some trial and error.
- To ensure that separators align just slightly to the left of the furthest edge of dropdowns, begin with the longest input title, because it sets the width of the window.
- To avoid adjusting separators if the longest input title is shorter than initially anticipated, extend its length using Unicode white space. Refer to the code example for input
level4Inputfor a demonstration.
Can I plot values from a local scope?
A script can use plot*() functions and other plot visuals only in the global scope — they cannot be included in the local scopes of conditional structures, loops, or user-defined functions and methods. Therefore, plots can only use variables and literals that are declared globally.
However, programmers can extract data from local scopes to the global scope to make the data accessible to plot*() functions. Assign the local scope values to globally declared variables, using return expressions or reference types, then use these global variables in plot*() calls to visualize the local data.
Alternatively, use Pine Logs or drawings to display values from within local scopes directly.