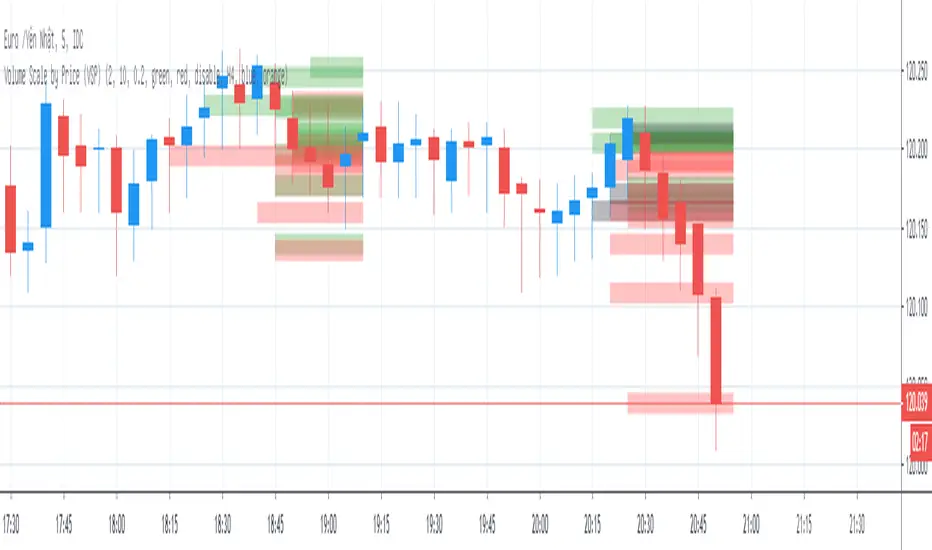
Volume Scale by Price (VSP) show volume of bar in y-axis (price-axis) with options below:
1. Number of histogram
* Number of histogram = 0 => do not plot volume histogram
* Number of histogram = 1 => plot volume of 21 lasted bar (bar [0] to bar [20])
* Number of histogram = 2 => plot volume of 21 bar next histogram 1 (bar [20] to bar [40])
2. Line width
* Columns width of histogram
3. Volume scale ratio
* Scaling histogram with justifiable ratio depend on time frame and symbol
4. Histogram color
* Color of histogram
リリースノート
* Base on idea of sam_m400 about Multi Time Frame mode, the script has updated with following details:1. Adding Muti Time Frame Mode: M5, M15, M30, H1, H4
2. Update Notes:
* Due to limited of drawing data, to enable MTF Mode, pls adjust No. histograms <= 1.
* Due to limited of function "security", the MTF Mode show only volume of lasted 18 bars.
3. Thank sam_m400 for your idea.
リリースノート
Add Buy & Sell color to Histogram.オープンソーススクリプト
TradingViewの精神に則り、このスクリプトの作者はコードをオープンソースとして公開してくれました。トレーダーが内容を確認・検証できるようにという配慮です。作者に拍手を送りましょう!無料で利用できますが、コードの再公開はハウスルールに従う必要があります。
免責事項
この情報および投稿は、TradingViewが提供または推奨する金融、投資、トレード、その他のアドバイスや推奨を意図するものではなく、それらを構成するものでもありません。詳細は利用規約をご覧ください。
オープンソーススクリプト
TradingViewの精神に則り、このスクリプトの作者はコードをオープンソースとして公開してくれました。トレーダーが内容を確認・検証できるようにという配慮です。作者に拍手を送りましょう!無料で利用できますが、コードの再公開はハウスルールに従う必要があります。
免責事項
この情報および投稿は、TradingViewが提供または推奨する金融、投資、トレード、その他のアドバイスや推奨を意図するものではなく、それらを構成するものでもありません。詳細は利用規約をご覧ください。