OPEN-SOURCE SCRIPT
更新済 MTF Phoenix Table
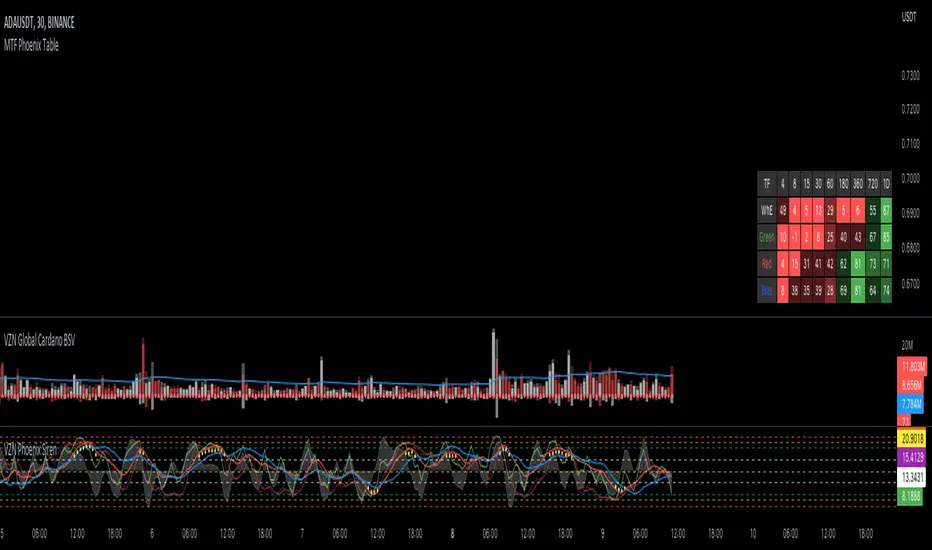
This is a MTF heatmap companion for the Phoenix Ascending indicator by WyckoffMode. It aims to make MTF analysis easier at a quick glance.
The row headings are color coordinated for easy visual recognition.
The row headings are color coordinated for easy visual recognition.
リリースノート
I have updated the table so that if a Phoenix Indicator Value in any time frame is currently trending down (relative to the previous bar) the text color in that cell will be fuchsia. Also I made a slight adjustment to two transparency levels for < 50 to help distinguish between them.
リリースノート
I reverted the text color change because it seems to have a bug. When the current chart timeframe is higher than the minimum timeframe in the table it doesn't always correctly call if the cell value is rising or falling.リリースノート
I was able to discover a fix so the table updated correctly and color the text correctly based on if the current cell value was less than the previous value. The text color that represents a descending value is yellow.リリースノート
Cell text color error removedリリースノート
As requested by some, I have adjusted the code so that the timeframes in the settings are adjustable and effect the TF header accordingly. All values under the daily will be expressed in minutes, e.g. 12H = 720.オープンソーススクリプト
TradingViewの精神に則り、このスクリプトの作者はコードをオープンソースとして公開してくれました。トレーダーが内容を確認・検証できるようにという配慮です。作者に拍手を送りましょう!無料で利用できますが、コードの再公開はハウスルールに従う必要があります。
免責事項
この情報および投稿は、TradingViewが提供または推奨する金融、投資、トレード、その他のアドバイスや推奨を意図するものではなく、それらを構成するものでもありません。詳細は利用規約をご覧ください。
オープンソーススクリプト
TradingViewの精神に則り、このスクリプトの作者はコードをオープンソースとして公開してくれました。トレーダーが内容を確認・検証できるようにという配慮です。作者に拍手を送りましょう!無料で利用できますが、コードの再公開はハウスルールに従う必要があります。
免責事項
この情報および投稿は、TradingViewが提供または推奨する金融、投資、トレード、その他のアドバイスや推奨を意図するものではなく、それらを構成するものでもありません。詳細は利用規約をご覧ください。