OPEN-SOURCE SCRIPT
更新済 Plot Level on Threshold Exceed
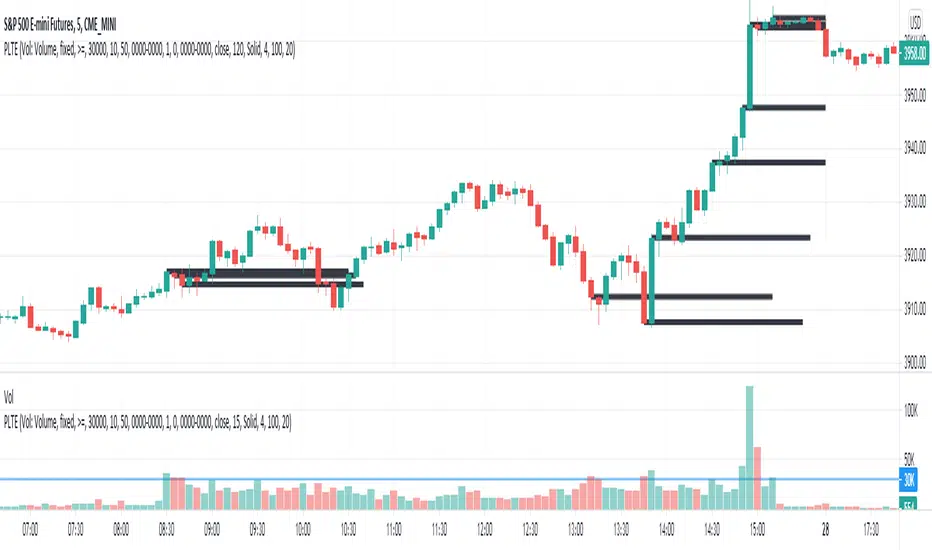
This script plots a line for X minutes, when the given reference source (which could be another indicator like volume, etc), exceeds the fixed value threshold.
There is a line limit in TV, so only the most recent 40 lines are plotted
There is a line limit in TV, so only the most recent 40 lines are plotted
リリースノート
Added numerous other threshold types (sma, ema, wma, rma, swma, percentiles)Added custom comparator logic (<, <=, =, >, >=)
Added threshold multiplier
Added ability to plot threshold itself
リリースノート
Added in sample session filter (only include samples during desired session times)Added in percentiles and stddev/ma thresholds
Added in efficiencies for line management
Added in plotshape functionality
リリースノート
Threshold offset field added to prevent current bar influencing the threshold itself (if desired)リリースノート
Updated with additional capabilities for plotarrow and plotcharリリースノート
Updated for cross-based comparatorsリリースノート
Updated arrow logic to be in line with threshold break direction, or alternatively select to reverse this logic.オープンソーススクリプト
TradingViewの精神に則り、このスクリプトの作者はコードをオープンソースとして公開してくれました。トレーダーが内容を確認・検証できるようにという配慮です。作者に拍手を送りましょう!無料で利用できますが、コードの再公開はハウスルールに従う必要があります。
免責事項
この情報および投稿は、TradingViewが提供または推奨する金融、投資、トレード、その他のアドバイスや推奨を意図するものではなく、それらを構成するものでもありません。詳細は利用規約をご覧ください。
オープンソーススクリプト
TradingViewの精神に則り、このスクリプトの作者はコードをオープンソースとして公開してくれました。トレーダーが内容を確認・検証できるようにという配慮です。作者に拍手を送りましょう!無料で利用できますが、コードの再公開はハウスルールに従う必要があります。
免責事項
この情報および投稿は、TradingViewが提供または推奨する金融、投資、トレード、その他のアドバイスや推奨を意図するものではなく、それらを構成するものでもありません。詳細は利用規約をご覧ください。