OPEN-SOURCE SCRIPT
Coppock Unchanged

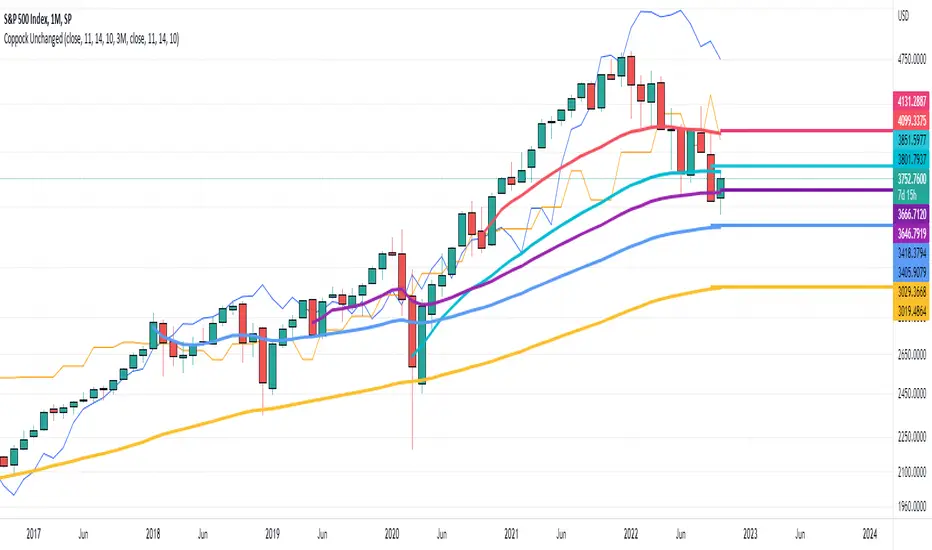
An implementation of the "Coppock Unchanged" plot concept by Tom McClellan.
Simply put, assume that for each bar, an alternative close creates a Coppock Plot that is unchanged, i.e. a close that generates a flat coppock curve.
This coppock unchanged plot can be used to:
1) identify a start of a trend on a long timescale (monthly) when the price goes above the coppock unchanged plot after a major correction
2) potentially identify an end of a trend when the prices goes below the coppock unchanged plot
See Tom McClellan's article 'Coppock Curve Still Working On a Major Bottom Signal' for a full explanation...
オープンソーススクリプト
TradingViewの精神に則り、このスクリプトの作者はコードをオープンソースとして公開してくれました。トレーダーが内容を確認・検証できるようにという配慮です。作者に拍手を送りましょう!無料で利用できますが、コードの再公開はハウスルールに従う必要があります。
免責事項
この情報および投稿は、TradingViewが提供または推奨する金融、投資、トレード、その他のアドバイスや推奨を意図するものではなく、それらを構成するものでもありません。詳細は利用規約をご覧ください。
オープンソーススクリプト
TradingViewの精神に則り、このスクリプトの作者はコードをオープンソースとして公開してくれました。トレーダーが内容を確認・検証できるようにという配慮です。作者に拍手を送りましょう!無料で利用できますが、コードの再公開はハウスルールに従う必要があります。
免責事項
この情報および投稿は、TradingViewが提供または推奨する金融、投資、トレード、その他のアドバイスや推奨を意図するものではなく、それらを構成するものでもありません。詳細は利用規約をご覧ください。