OPEN-SOURCE SCRIPT
更新済 Relative Strength NSE:Nifty for TF Community
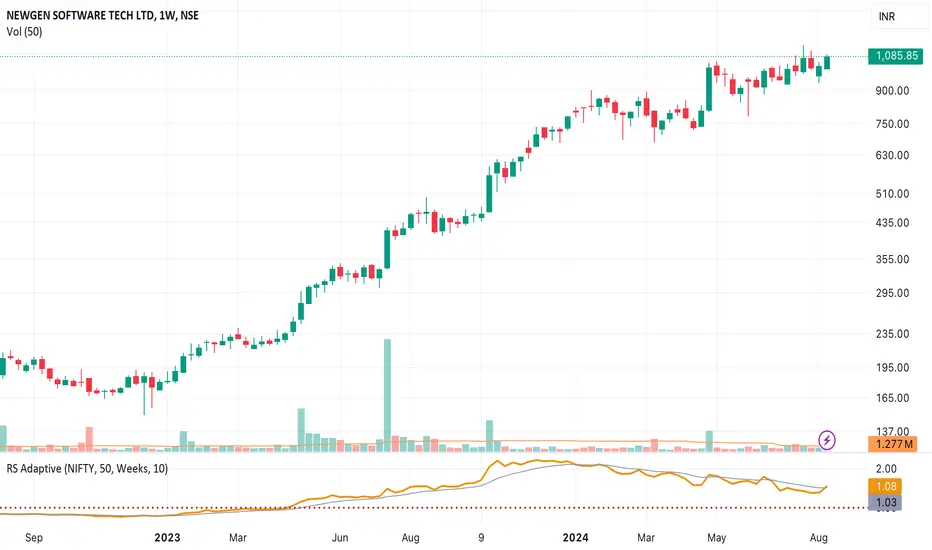
This is a modified version of the Relative Strength Indicator (No confusion with RSI) originally by in.tradingview.com/u/modhelius/ based on in.tradingview.com/script/A4WyMCKM-Relative-Strength/. The indicator calculates the relative strength between a selected stock and a comparative symbol (typically a market index like NSE:NIFTY).
Relative strength (RS) compares the performance of two assets, typically a stock and a market index, by dividing their percentage changes over a specific period. This indicator oscillates around zero:
- Greater than 0: Indicates the stock has outperformed the comparative symbol.
- Less than 0: Indicates the stock has underperformed the comparative symbol.
Key Enhancements:
This Relative Strength Indicator offers practical features to automatically adjusts the comparison period based on the chart’s timeframe, whether daily, weekly, or monthly, so you don’t have to make manual changes.
Secondly, if the selected stock has fewer bars than the comparison period, the indicator uses the shorter period to ensure accurate results. The default colors are hardcoded so they look fine for both dark and white themes, but of course can be changed.
You can customise the settings to fit your needs. The default period is set to 50/52, and the comparative symbol is NSE:NIFTY, but both can be changed. There’s also an option to toggle a moving average on or off, providing a smoother visual representation.
リリースノート
Change the SMA to EMA as per TF Community recommendation - Exponential MA is better than Simple MA. リリースノート
Chart changed to simple one. オープンソーススクリプト
TradingViewの精神に則り、このスクリプトの作者はコードをオープンソースとして公開してくれました。トレーダーが内容を確認・検証できるようにという配慮です。作者に拍手を送りましょう!無料で利用できますが、コードの再公開はハウスルールに従う必要があります。
免責事項
この情報および投稿は、TradingViewが提供または推奨する金融、投資、トレード、その他のアドバイスや推奨を意図するものではなく、それらを構成するものでもありません。詳細は利用規約をご覧ください。
オープンソーススクリプト
TradingViewの精神に則り、このスクリプトの作者はコードをオープンソースとして公開してくれました。トレーダーが内容を確認・検証できるようにという配慮です。作者に拍手を送りましょう!無料で利用できますが、コードの再公開はハウスルールに従う必要があります。
免責事項
この情報および投稿は、TradingViewが提供または推奨する金融、投資、トレード、その他のアドバイスや推奨を意図するものではなく、それらを構成するものでもありません。詳細は利用規約をご覧ください。