Executer
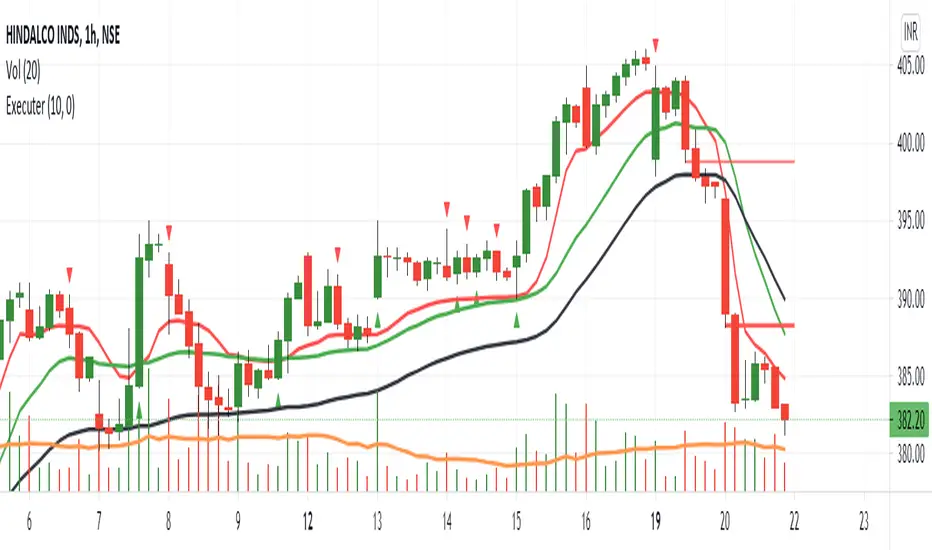
1. Triangle down and up symbol : One can consider this as 1st point of confirmation. This considers the volume and momentum.
2. Moving average band ( To identify the trend ) : When the red line is above all the other lines means trend is up or positive, so buy only when trend is UP.
Red line is below all other line means Trend is negative or Down, consider always to sell when trend is negative.
When redline is between green and black then trend is sideways or you may expect a big move and risk to reward ratio will be better in this type of setup.
When the red line is up then black line acts as Stop loss point.
3. Horizontal lines : Dynamic horizontal lines acts as booster to the trend or safe buying or selling point. This analyze the trend, candle strength and momentum to give the buying point or selling point. Here 1st thin line shows the start of trend and thick line shows the strong trend. Lines get deleted when the buying or selling point is invalid or one may consider the fresh points.
This helps to eliminate lot of sideways trends.
This indicator is fully customizable based on your requirement.
Consider more signal option if you don't want to miss the opportunity. If you are safe trader then no need of that.
招待専用スクリプト
このスクリプトにアクセスできるのは作者から許可されたユーザーに限られており、通常は支払いが必要になります。スクリプトをお気に入りに追加することはできますが、使用するにはその作者に許可を申請し、その許可を得る必要があります ― 詳細についてはこちらをご覧ください。さらに詳しい情報が必要な場合は下記の作成者からの手引きをご覧になるか、SupplyIsInDemandに直接お問い合わせください。
スクリプトの機能を理解し、その作者を全面的に信頼しているのでなければ、お金を支払ってまでそのスクリプトを利用することをTradingViewとしては「非推奨」としています。コミュニティスクリプトの中で、その代わりとなる無料かつオープンソースのスクリプトを見つけられる可能性もあります。
作者の指示
警告: 招待専用スクリプトへのアクセスをリクエストする前に弊社のガイドをお読みください。
免責事項
招待専用スクリプト
このスクリプトにアクセスできるのは作者から許可されたユーザーに限られており、通常は支払いが必要になります。スクリプトをお気に入りに追加することはできますが、使用するにはその作者に許可を申請し、その許可を得る必要があります ― 詳細についてはこちらをご覧ください。さらに詳しい情報が必要な場合は下記の作成者からの手引きをご覧になるか、SupplyIsInDemandに直接お問い合わせください。
スクリプトの機能を理解し、その作者を全面的に信頼しているのでなければ、お金を支払ってまでそのスクリプトを利用することをTradingViewとしては「非推奨」としています。コミュニティスクリプトの中で、その代わりとなる無料かつオープンソースのスクリプトを見つけられる可能性もあります。
作者の指示
警告: 招待専用スクリプトへのアクセスをリクエストする前に弊社のガイドをお読みください。