PROTECTED SOURCE SCRIPT
RSI Divergence
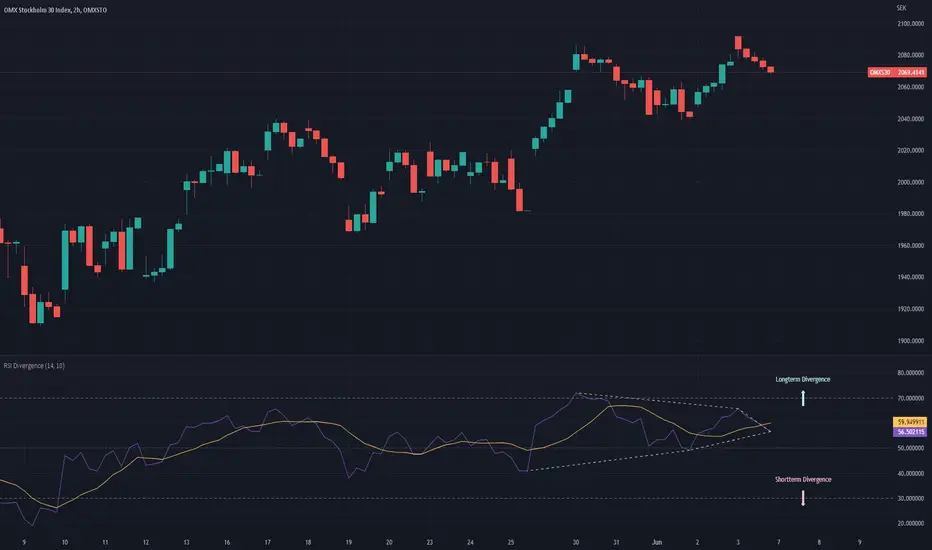
The RSI DIvergence script tries to predict the upper and lower trend-lines for the current security’s RSI.
The script identifies peaks and valleys within the RSI and then tries to draw a trend-line in between the peaks and the valleys. The longest possible trend-line originating from the latest peak/valley will be used to determine whether or not the trend is moving up or down, the slope of the trend-line will then dictate the direction of the trend.
(If no trend line can be drawn from the latest peak/valley, the current value of the RSI will be used as the origin point of the trend-line)
Once the script has identified the trendlines they will be superimposed on the RSI line as dashed lines. The color of the dashed lines will depend on the direction of the trend, an upwards moving trend will be depicted in green,whilst a downwards moving trend will be depicted in red.
Furthermore, the script will draw two arrows, representing the short term trend and the long term trend, as to make it even more clear which direction the two trend-lines have.
If only one trend-line (either upper or lower) can be found, the script will replace the corresponding arrow with a diamond shape instead.
保護スクリプト
このスクリプトのソースコードは非公開で投稿されています。 ただし、制限なく自由に使用できます – 詳細はこちらでご確認ください。
免責事項
この情報および投稿は、TradingViewが提供または推奨する金融、投資、トレード、その他のアドバイスや推奨を意図するものではなく、それらを構成するものでもありません。詳細は利用規約をご覧ください。
保護スクリプト
このスクリプトのソースコードは非公開で投稿されています。 ただし、制限なく自由に使用できます – 詳細はこちらでご確認ください。
免責事項
この情報および投稿は、TradingViewが提供または推奨する金融、投資、トレード、その他のアドバイスや推奨を意図するものではなく、それらを構成するものでもありません。詳細は利用規約をご覧ください。