INVITE-ONLY SCRIPT
更新済 Projected EMA based on past 21 days [UOI]
As we transition from a bear market to a more positive market sentiment, many equities are starting to rise above the 200-day Exponential Moving Average (EMA) and experience significant price increases solely based on this technical factor.
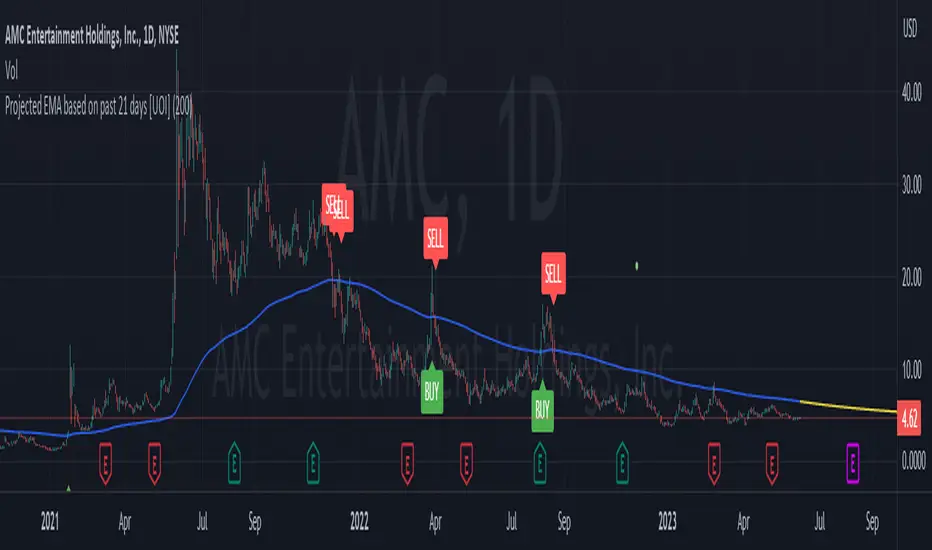
Here is a good example with AMC :
AMC :

This indicator is designed to help you predict the future crossover point by calculating the average price over the past 21 days and projecting the 200-day EMA for the future.
This indicator is tailored to assist average individuals who are interested in swing trading stocks or other securities. It enables them to anticipate when the price of a stock might move above or below a significant level known as the 200-day EMA, although it can be adjusted to different values like 100 or 50 EMA. When a stock price moves above the 200-day EMA, it is often considered a positive sign for future price increases.
Here is how this can help us understand the natural cycle of price action:

The indicator functions by calculating the average price over the past 200 days, which helps smooth out daily price fluctuations and provides a clearer perspective of the overall trend. It also considers the average price change over the previous 21 days to project future prices. By doing so, it aims to predict when the price might cross above the 200-day EMA line.
When utilizing this indicator, you will observe two lines on the price chart. The first line represents the 200-day EMA, visually depicting the average price trend. The second set of lines, displayed as dashed lines, indicate potential future price movements. These lines assist in anticipating when the price might surpass the 200-day EMA line, indicating a potential upcoming bullish (upward) trend.
To summarize, this indicator serves as a valuable tool for average individuals interested in trading securities. It facilitates the identification of critical points in stock prices, empowering users to make more informed decisions regarding when to buy or sell based on projected movements relative to the 200-day EMA line.
Here is a good example with
This indicator is designed to help you predict the future crossover point by calculating the average price over the past 21 days and projecting the 200-day EMA for the future.
This indicator is tailored to assist average individuals who are interested in swing trading stocks or other securities. It enables them to anticipate when the price of a stock might move above or below a significant level known as the 200-day EMA, although it can be adjusted to different values like 100 or 50 EMA. When a stock price moves above the 200-day EMA, it is often considered a positive sign for future price increases.
Here is how this can help us understand the natural cycle of price action:
The indicator functions by calculating the average price over the past 200 days, which helps smooth out daily price fluctuations and provides a clearer perspective of the overall trend. It also considers the average price change over the previous 21 days to project future prices. By doing so, it aims to predict when the price might cross above the 200-day EMA line.
When utilizing this indicator, you will observe two lines on the price chart. The first line represents the 200-day EMA, visually depicting the average price trend. The second set of lines, displayed as dashed lines, indicate potential future price movements. These lines assist in anticipating when the price might surpass the 200-day EMA line, indicating a potential upcoming bullish (upward) trend.
To summarize, this indicator serves as a valuable tool for average individuals interested in trading securities. It facilitates the identification of critical points in stock prices, empowering users to make more informed decisions regarding when to buy or sell based on projected movements relative to the 200-day EMA line.
リリースノート
added buy sell signal with certain conditions. This is ideal for higher timeframe リリースノート
Updated buy sell signal to be off by default. users can turn them onリリースノート
updated the length to past 21 days招待専用スクリプト
このスクリプトは作者が承認したユーザーのみアクセス可能です。使用するにはアクセス申請をして許可を得る必要があります。通常は支払い後に承認されます。詳細は下記の作者の指示に従うか、uoi2020に直接お問い合わせください。
TradingViewは、作者を完全に信頼し、スクリプトの動作を理解していない限り、有料スクリプトの購入・使用を推奨しません。コミュニティスクリプトには無料のオープンソースの代替が多数あります。
作者の指示
Request access via my Twitter subscriber/beta tester page: @userofintellect
免責事項
この情報および投稿は、TradingViewが提供または推奨する金融、投資、トレード、その他のアドバイスや推奨を意図するものではなく、それらを構成するものでもありません。詳細は利用規約をご覧ください。
招待専用スクリプト
このスクリプトは作者が承認したユーザーのみアクセス可能です。使用するにはアクセス申請をして許可を得る必要があります。通常は支払い後に承認されます。詳細は下記の作者の指示に従うか、uoi2020に直接お問い合わせください。
TradingViewは、作者を完全に信頼し、スクリプトの動作を理解していない限り、有料スクリプトの購入・使用を推奨しません。コミュニティスクリプトには無料のオープンソースの代替が多数あります。
作者の指示
Request access via my Twitter subscriber/beta tester page: @userofintellect
免責事項
この情報および投稿は、TradingViewが提供または推奨する金融、投資、トレード、その他のアドバイスや推奨を意図するものではなく、それらを構成するものでもありません。詳細は利用規約をご覧ください。