OPEN-SOURCE SCRIPT
CUSUM Peaks & Troughs with Drift

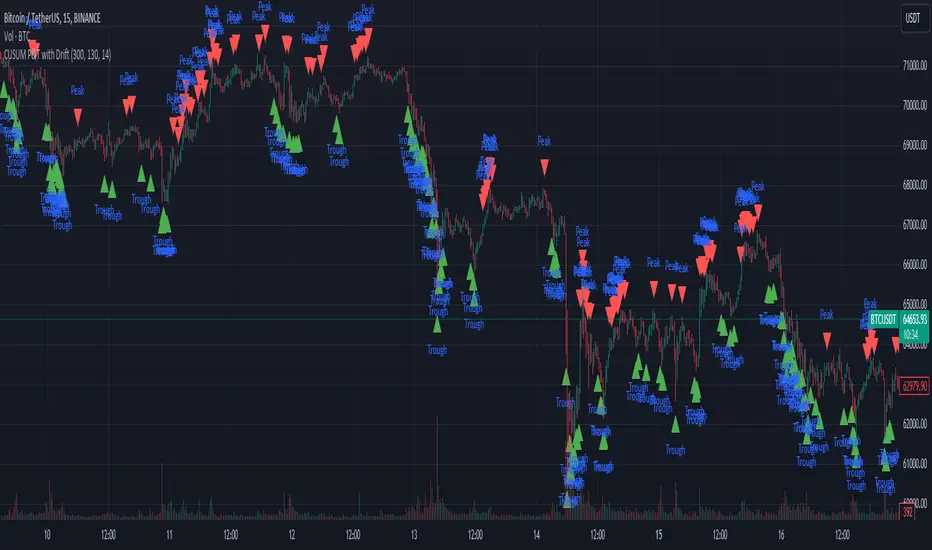
This script implements an Improved CUSUM (Cumulative Sum) Peaks & Troughs with Drift indicator. Here's a breakdown of how it works:
Input Parameters:
cusumThreshold: Threshold value for detecting peaks and troughs.
cusumDrift: Drift value used to adjust the CUSUM calculation.
movingAverageLength: Length of the moving average used as a reference for deviation calculation.
Moving Average Calculation:
Calculates the simple moving average (SMA) of the closing prices over a specified length.
Price Deviation Calculation:
Computes the deviation of the closing price from the moving average.
CUSUM Calculation with Drift:
Utilises cumulative sum (CUSUM) calculations with drift adjustment.
Tracks positive and negative deviations from the moving average, considering the specified drift value.
Peak and Trough Detection:
Detects peaks and troughs based on the predefined thresholds (cusumThreshold).
Resets the CUSUM values when peaks or troughs are detected.
Plotting:
Plots shapes (triangles) above the bars for peaks and below the bars for troughs.
Optionally, you can uncomment the lines to visualise the CUSUM values and the zero line for reference.
This indicator helps identify potential turning points or reversals in the price action by detecting peaks (high points) and troughs (low points) in the cumulative sum of price deviations from the moving average, considering drift to adapt to underlying trends in the data.
オープンソーススクリプト
TradingViewの精神に則り、この作者はスクリプトのソースコードを公開しているので、その内容を理解し検証することができます。作者に感謝です!無料でお使いいただけますが、このコードを投稿に再利用する際にはハウスルールに従うものとします。
免責事項
これらの情報および投稿は、TradingViewが提供または保証する金融、投資、取引、またはその他の種類のアドバイスや推奨を意図したものではなく、またそのようなものでもありません。詳しくは利用規約をご覧ください。
オープンソーススクリプト
TradingViewの精神に則り、この作者はスクリプトのソースコードを公開しているので、その内容を理解し検証することができます。作者に感謝です!無料でお使いいただけますが、このコードを投稿に再利用する際にはハウスルールに従うものとします。
免責事項
これらの情報および投稿は、TradingViewが提供または保証する金融、投資、取引、またはその他の種類のアドバイスや推奨を意図したものではなく、またそのようなものでもありません。詳しくは利用規約をご覧ください。