OPEN-SOURCE SCRIPT
Madrid Profit Area
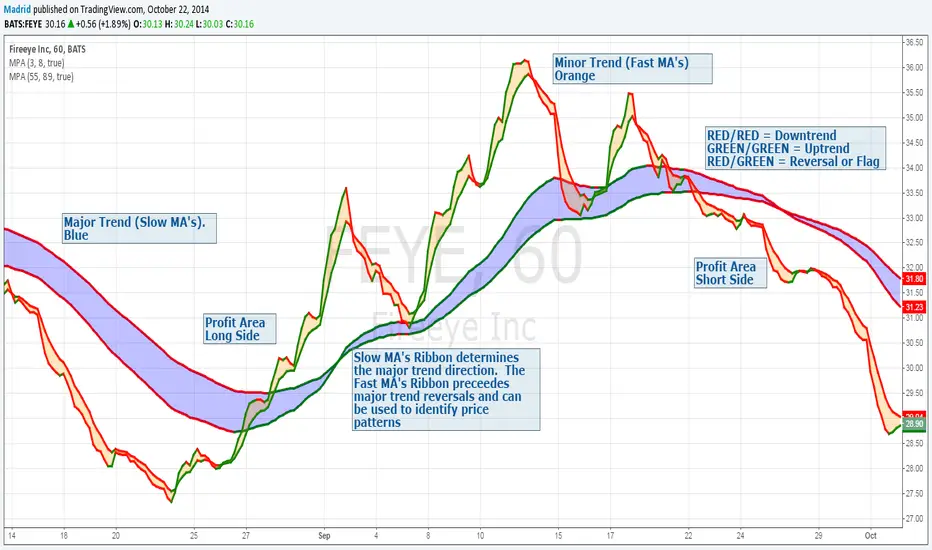
This study displays a ribbon made of two moving averages identified by a filled Area. This provides visual aids to determine the trend direction and pivot points. The moving average will be Red if its value is decreasing, and green if it is increasing. When both MA's are the same color we have a trend direction. If those are different then we have a trend reversal and a pivot point.
If combined with another ribbon then it can be configured so we have a pair of slow MA's and another pair of fast MA's , this can visually determine if the price is in bull or bear territory following the basic rules:
1. Fast MA pair above the slow MA Pair = Bullish
2. Fast MA pair below the slow MA Pair = Bearish
3. If the fast MA crosses over the slow MA it is a Bullish reversal
4. If the fast MA crosses below the the slow MA, it is a Bearish reversal.
The use of the ribbons without the price bars or line reduces the noise inherent to the price
オープンソーススクリプト
TradingViewの精神に則り、このスクリプトの作者はコードをオープンソースとして公開してくれました。トレーダーが内容を確認・検証できるようにという配慮です。作者に拍手を送りましょう!無料で利用できますが、コードの再公開はハウスルールに従う必要があります。
免責事項
この情報および投稿は、TradingViewが提供または推奨する金融、投資、トレード、その他のアドバイスや推奨を意図するものではなく、それらを構成するものでもありません。詳細は利用規約をご覧ください。
オープンソーススクリプト
TradingViewの精神に則り、このスクリプトの作者はコードをオープンソースとして公開してくれました。トレーダーが内容を確認・検証できるようにという配慮です。作者に拍手を送りましょう!無料で利用できますが、コードの再公開はハウスルールに従う必要があります。
免責事項
この情報および投稿は、TradingViewが提供または推奨する金融、投資、トレード、その他のアドバイスや推奨を意図するものではなく、それらを構成するものでもありません。詳細は利用規約をご覧ください。