INVITE-ONLY SCRIPT
Auto Linear Regression Channel
A Linear Regression Channel gives more objective potential buy and sell signals based on price volatility. It consists of three parts:
Linear Regression Line: A Linear Regression Line is a straight line that best fits the prices between a starting price point and an ending price point. A "best fit" means that a line is constructed where there is the least amount of space between the price points and the actual Linear Regression Line. The Linear Regression Line is mainly used to determine trend direction.
Traders usually view the Linear Regression Line as the fair value price for the stocks. When prices deviate above or below, traders may expect prices to go back towards the Linear Regression Line. As a consequence, when prices are below the Linear Regression Line, this could be viewed by some traders as a good time to buy, and when prices are above the Linear Regression Line, a trader might sell. Of course other technical indicators would be used to confirm these inexact buy and sell signals.
Upper Channel Line: A line that runs parallel to the Linear Regression Line and is usually one to two standard deviations above the Linear Regression Line.
Lower Channel Line: This line runs parallel to the Linear Regression Line and is usually one to two standard deviations below the Linear Regression Line.
The upper and lower channel lines contain between themselves either 68% of all prices (if 1 standard deviation is used) or 95% of all prices (if 2 standard deviations are used). When prices break outside of the channels, either: Buy or sell opportunities are present. Or the prior trend could be ending.
Linear Regression Channel Possible Buy Signal
When price falls below the lower channel line, and a trader expects a continuation of the trend, then a trader might consider it as a buy signal.
Linear Regression Channel Possible Sell Signal
An opportunity for selling might occur when prices break above the upper channel line, but a continuation of the trend is expected by the trader. Other confirmation signs like prices closing back inside the linear regression channel might be used to initiate potential buy or sell orders. Also, other technical indicators might be used to confirm.
Trend Reversals
When price closes outside of the Linear Regression Channel for long periods of time, this is often interpreted as an early signal that the past price trend may be breaking and a significant reversal might be near. Linear Regression Channels are quite useful technical analysis charting tools. In addition to identifying trends and trend direction, the use of standard deviation gives traders ideas as to when prices are becoming overbought or oversold relative to the long term trend.
Default Parameters:
Period: (100) The number of bars to use in the calculation.
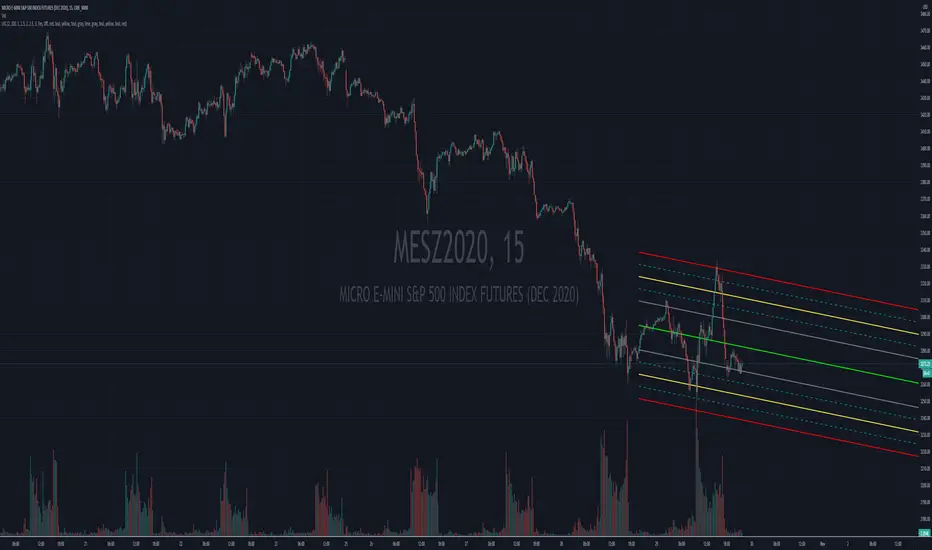
This Linear Regression Channel Has 1st, 2nd, and 3rd Deviation lines also the MId Deviation Lines are added for 1.5 and 2.5 area.
Linear Regression Line: A Linear Regression Line is a straight line that best fits the prices between a starting price point and an ending price point. A "best fit" means that a line is constructed where there is the least amount of space between the price points and the actual Linear Regression Line. The Linear Regression Line is mainly used to determine trend direction.
Traders usually view the Linear Regression Line as the fair value price for the stocks. When prices deviate above or below, traders may expect prices to go back towards the Linear Regression Line. As a consequence, when prices are below the Linear Regression Line, this could be viewed by some traders as a good time to buy, and when prices are above the Linear Regression Line, a trader might sell. Of course other technical indicators would be used to confirm these inexact buy and sell signals.
Upper Channel Line: A line that runs parallel to the Linear Regression Line and is usually one to two standard deviations above the Linear Regression Line.
Lower Channel Line: This line runs parallel to the Linear Regression Line and is usually one to two standard deviations below the Linear Regression Line.
The upper and lower channel lines contain between themselves either 68% of all prices (if 1 standard deviation is used) or 95% of all prices (if 2 standard deviations are used). When prices break outside of the channels, either: Buy or sell opportunities are present. Or the prior trend could be ending.
Linear Regression Channel Possible Buy Signal
When price falls below the lower channel line, and a trader expects a continuation of the trend, then a trader might consider it as a buy signal.
Linear Regression Channel Possible Sell Signal
An opportunity for selling might occur when prices break above the upper channel line, but a continuation of the trend is expected by the trader. Other confirmation signs like prices closing back inside the linear regression channel might be used to initiate potential buy or sell orders. Also, other technical indicators might be used to confirm.
Trend Reversals
When price closes outside of the Linear Regression Channel for long periods of time, this is often interpreted as an early signal that the past price trend may be breaking and a significant reversal might be near. Linear Regression Channels are quite useful technical analysis charting tools. In addition to identifying trends and trend direction, the use of standard deviation gives traders ideas as to when prices are becoming overbought or oversold relative to the long term trend.
Default Parameters:
Period: (100) The number of bars to use in the calculation.
This Linear Regression Channel Has 1st, 2nd, and 3rd Deviation lines also the MId Deviation Lines are added for 1.5 and 2.5 area.
招待専用スクリプト
このスクリプトは作者が承認したユーザーのみアクセス可能です。使用するにはアクセス申請をして許可を得る必要があります。通常は支払い後に承認されます。詳細は下記の作者の指示に従うか、DarkSideTraderに直接お問い合わせください。
TradingViewは、作者を完全に信頼し、スクリプトの動作を理解していない限り、有料スクリプトの購入・使用を推奨しません。コミュニティスクリプトには無料のオープンソースの代替が多数あります。
作者の指示
Follow us
Twitter twitter.com/darksidetrader
YouTube youtube.com/channel/UCAR8aMbticG9ePJrxeZ8mjw
Join Chat Room discord.gg/N4HSqJN96X
Website tradersofwallst.com
Live
9:00 AM EST to 2:30 PM EST
Twitter twitter.com/darksidetrader
YouTube youtube.com/channel/UCAR8aMbticG9ePJrxeZ8mjw
Join Chat Room discord.gg/N4HSqJN96X
Website tradersofwallst.com
Live
9:00 AM EST to 2:30 PM EST
免責事項
この情報および投稿は、TradingViewが提供または推奨する金融、投資、トレード、その他のアドバイスや推奨を意図するものではなく、それらを構成するものでもありません。詳細は利用規約をご覧ください。