OPEN-SOURCE SCRIPT
SMA Dashboard | Flux Charts
💎 GENERAL OVERVIEW
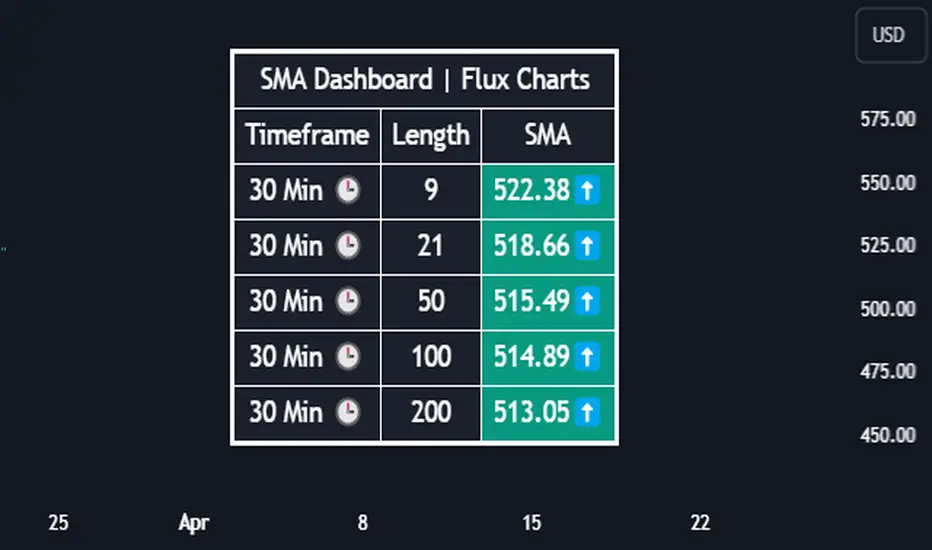
Introducing our new Simple Moving Average (SMA) Dashboard! This dashboard let's you select a source for the calculation of the SMA of it, then shows it across 5 different lengths and timeframes.

Features of the new SMA Dashboard :
📌 HOW DOES IT WORK ?
SMA is a widely used indicatior within trading community, it simply works by taking the mathematical average of a source by desired length. This indicator then shows it across 5 different timeframes in a dashboard and plots them in your chart for ease of use.

🚩UNIQUENESS
This dashboard cuts through the hassle of manual SMA calculations and plotting. It offers flexibility by allowing various data sources (even custom indicators) and customization through enabling / disabling SMA lines. The clear visualization lets you compare multiple SMAs efficiently.
⚙️SETTINGS
1. Timeframes
You can set up to 5 timeframes & lengths for the dashboard to show here. You can also turn on plotting and enable / disable them.
2. General Configuration
SMA Source -> You can select the source for the calculation of the SMA here. You can select sources from other indicators as well as more general sources like close, high and low price.
Introducing our new Simple Moving Average (SMA) Dashboard! This dashboard let's you select a source for the calculation of the SMA of it, then shows it across 5 different lengths and timeframes.
Features of the new SMA Dashboard :
- Shows SMA Across 5 Different Lengths & Timeframes.
- Select Any Source, Including Other Indicators.
- Enable / Disable Plotting Lines.
- Customizable Dashboard.
📌 HOW DOES IT WORK ?
SMA is a widely used indicatior within trading community, it simply works by taking the mathematical average of a source by desired length. This indicator then shows it across 5 different timeframes in a dashboard and plots them in your chart for ease of use.
🚩UNIQUENESS
This dashboard cuts through the hassle of manual SMA calculations and plotting. It offers flexibility by allowing various data sources (even custom indicators) and customization through enabling / disabling SMA lines. The clear visualization lets you compare multiple SMAs efficiently.
⚙️SETTINGS
1. Timeframes
You can set up to 5 timeframes & lengths for the dashboard to show here. You can also turn on plotting and enable / disable them.
2. General Configuration
SMA Source -> You can select the source for the calculation of the SMA here. You can select sources from other indicators as well as more general sources like close, high and low price.
オープンソーススクリプト
TradingViewの精神に則り、このスクリプトの作者はコードをオープンソースとして公開してくれました。トレーダーが内容を確認・検証できるようにという配慮です。作者に拍手を送りましょう!無料で利用できますが、コードの再公開はハウスルールに従う必要があります。
Access Flux Charts' exclusive indicators: fluxcharts.com/
Join our Discord community: discord.gg/FluxCharts
Join our Discord community: discord.gg/FluxCharts
免責事項
この情報および投稿は、TradingViewが提供または推奨する金融、投資、トレード、その他のアドバイスや推奨を意図するものではなく、それらを構成するものでもありません。詳細は利用規約をご覧ください。