OPEN-SOURCE SCRIPT
更新済 Morun Astro Trend MAs cross Strategy
Astrology machine learning cycles indicator signals with technical MAs indicators strategy, based on signals index of Github project github.com/financial-astrology-research/financial-astrology-stats
リリースノート
This strategy is based on financial astrology cycles for each asset detected with advanced machine learning techniques, the strategy portfolio includes the crypto-currencies: ADA, BAT, BNB, BTC, DASH, EOS, ETC, ETH, LINK, LTC, XLM, XRP, ZEC and ZRX. The daily price trend is forecasted through this planets cycles (aspects, declination and speed phases), the combination of all this cycles produce a daily price trend prediction that is encoded into a PineScript array using binary format "0 or 1" that represent short and long daily trend respectively.Combining the daily trend with MAs crossover is possible to find very good trade opportunities, the average monthly accuracy of the astro cycles models is 57%-60%, this means that from 30 average days in a month usually 60% of the daily price trend predictions will be correct except in the months when cycles are out of phase. Usually the cycle re-align in few weeks due the fact that Moon, Mercury, Venus and Sun are the more repetitive cycles that tend to dominate the human emotions so only when slow planets cycles interferes with fast cycles the accuracy will be affected.
You will need to tune the Master Cycle, consolidation bars, hours shift, trailing stop and stop loss parameters to best fit each market conditions and backtest to ensure that the strategy is correctly calibrated.
The previous version included signals up to 30 June 2021, with this update we include signals from January 1, 2021 to 31 December 2022, the purpose of past signals is to allow backtesting for the strategy parameters tuning. Additionally, we have simplified the parameters to the ones that are most relevant to improve the signals accuracy. Finally, we expose the smooth daily trend signals (moving average scaled to recent price) that provide an indicator of possible turning points, this signal is projected 2 weeks into the future so it is a leading trend indicator very handy for determining sideways market conditions where is not worth to be in the market.
DISCLAIMER: This strategy is experimental and don’t provide financial or investment advice, the main purpose is to document the research observations within financial astrology field. Any allocation of funds following the documented machine learning model prediction is a high-risk endeavour and it’s the users responsibility to practice healthy risk management according to your situation.
リリースノート
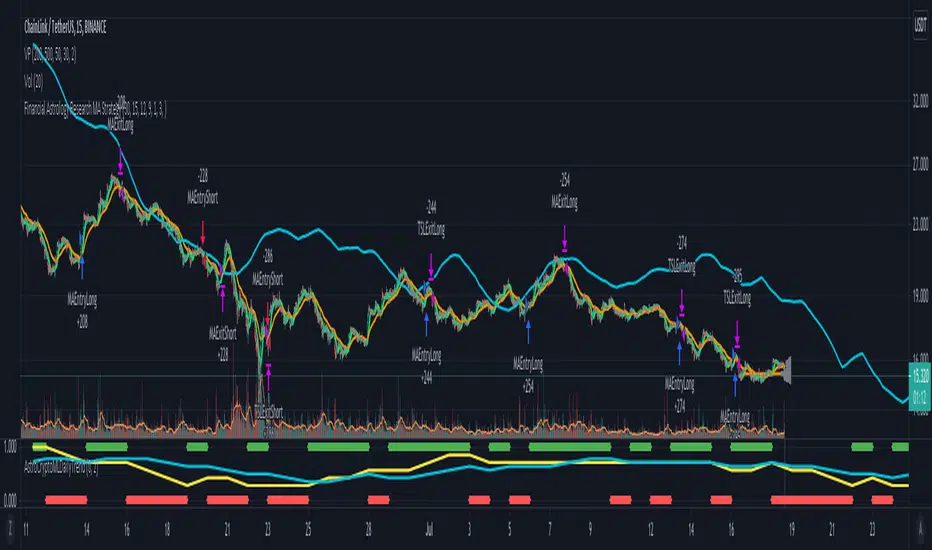
Updated max_bars_back to 4000 and display LINKUSDT backtest results. Please note that combining with the Financial Astrology Crypto ML Daily Trend indicator 
リリースノート
Improve astro ML daily trend to price scale conversion smoothing and reduce the astro ML signal future projection to 1 week (7 days) in intraday timeframe resolutions to avoid that signal plot is empty in past price bars.オープンソーススクリプト
TradingViewの精神に則り、このスクリプトの作者はコードをオープンソースとして公開してくれました。トレーダーが内容を確認・検証できるようにという配慮です。作者に拍手を送りましょう!無料で利用できますが、コードの再公開はハウスルールに従う必要があります。
免責事項
この情報および投稿は、TradingViewが提供または推奨する金融、投資、トレード、その他のアドバイスや推奨を意図するものではなく、それらを構成するものでもありません。詳細は利用規約をご覧ください。
オープンソーススクリプト
TradingViewの精神に則り、このスクリプトの作者はコードをオープンソースとして公開してくれました。トレーダーが内容を確認・検証できるようにという配慮です。作者に拍手を送りましょう!無料で利用できますが、コードの再公開はハウスルールに従う必要があります。
免責事項
この情報および投稿は、TradingViewが提供または推奨する金融、投資、トレード、その他のアドバイスや推奨を意図するものではなく、それらを構成するものでもありません。詳細は利用規約をご覧ください。