OPEN-SOURCE SCRIPT
更新済 Visual RSI
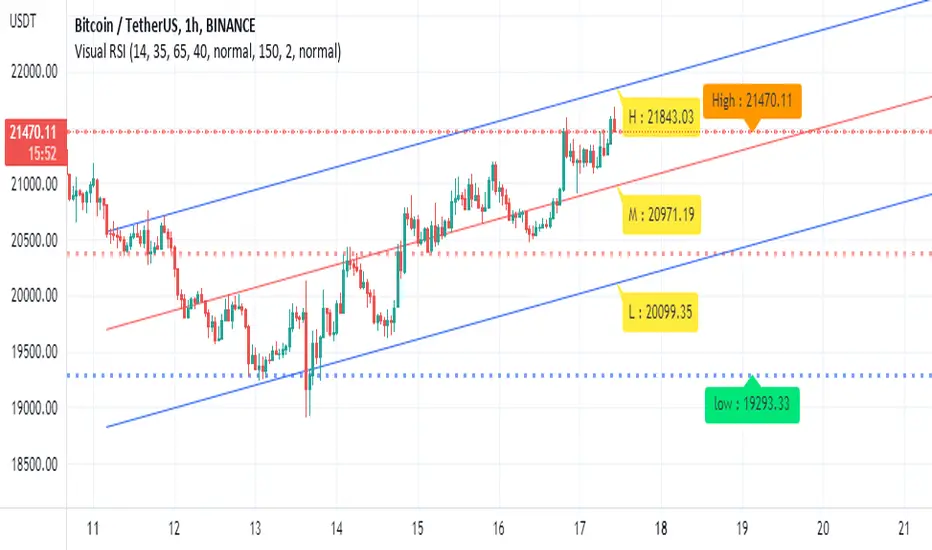
This is a visual format of regular RSI on the screen.
The indicator give you the RSI level for the high and lows and average as well. So it very easy to use it as you normally do with any RSI
buy point are when price reach bellow lower level and start breaking up. sell vice versa
it a concept idea to make our regular RSI more effective for the common user
I hope you like it
1 min chart

15min

The indicator give you the RSI level for the high and lows and average as well. So it very easy to use it as you normally do with any RSI
buy point are when price reach bellow lower level and start breaking up. sell vice versa
it a concept idea to make our regular RSI more effective for the common user
I hope you like it
1 min chart
15min
リリースノート
add linear regression to make analysis better オープンソーススクリプト
TradingViewの精神に則り、このスクリプトの作者はコードをオープンソースとして公開してくれました。トレーダーが内容を確認・検証できるようにという配慮です。作者に拍手を送りましょう!無料で利用できますが、コードの再公開はハウスルールに従う必要があります。
免責事項
この情報および投稿は、TradingViewが提供または推奨する金融、投資、トレード、その他のアドバイスや推奨を意図するものではなく、それらを構成するものでもありません。詳細は利用規約をご覧ください。
オープンソーススクリプト
TradingViewの精神に則り、このスクリプトの作者はコードをオープンソースとして公開してくれました。トレーダーが内容を確認・検証できるようにという配慮です。作者に拍手を送りましょう!無料で利用できますが、コードの再公開はハウスルールに従う必要があります。
免責事項
この情報および投稿は、TradingViewが提供または推奨する金融、投資、トレード、その他のアドバイスや推奨を意図するものではなく、それらを構成するものでもありません。詳細は利用規約をご覧ください。