OPEN-SOURCE SCRIPT
更新済 ICT Daily Levels and Zones (fadi)

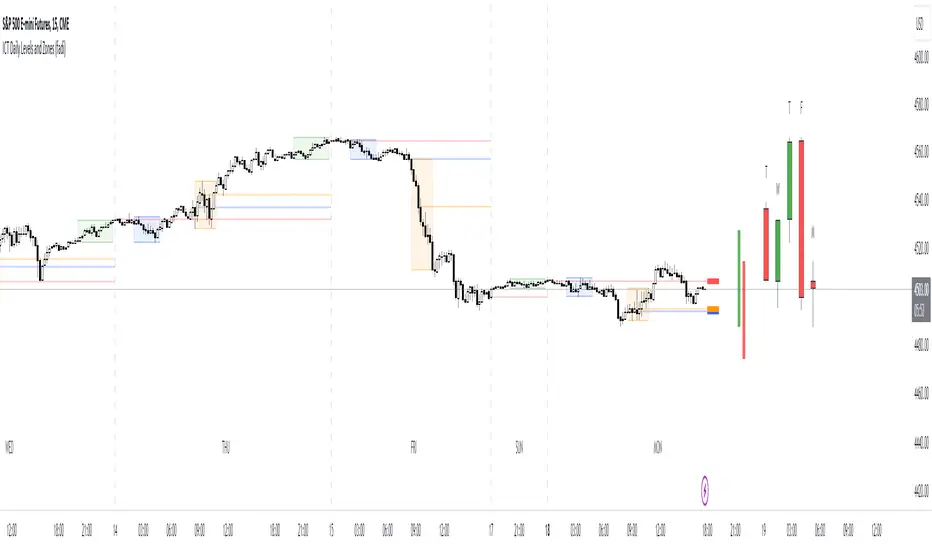
ICT Daily Levels and Zones indicator provides some of the relevant zones and levels for ICT type analysis. The purpose of this indicator is to provide consolidated way of automatically highlighting and identifying relevant levels for ICT type traders.
Daily Separator and Day of Week
Display a separator based on NY Midnight and day of week.
https://www.tradingview.com/x/ii7nysKT/
Killzones
Highlight ICT Asia, London, and NY killzones. Please note that the default times are based on Index Futures. Update the times of day if you plan on using it for other instruments such as Forex.
https://www.tradingview.com/x/HEBFXQ08/
Open Range
The 9:30am to 10:00am open range
(Shown with Extend setting on)

Open Range Gap
The open range Gap is the difference between the 4:15pm close and the 9:30am open.
(Shown with Extend setting on)
https://www.tradingview.com/x/jAy3OeCR/
Time of Day Levels
The Midnight, 8:30am, and 9:30am open levels.
https://www.tradingview.com/x/ZDYJpkJx/
Daily Midnight Candle
ICT style Daily candle formation based on Midnight open
https://www.tradingview.com/x/FBRNgQJg/
Daily Separator and Day of Week
Display a separator based on NY Midnight and day of week.
https://www.tradingview.com/x/ii7nysKT/
Killzones
Highlight ICT Asia, London, and NY killzones. Please note that the default times are based on Index Futures. Update the times of day if you plan on using it for other instruments such as Forex.
https://www.tradingview.com/x/HEBFXQ08/
Open Range
The 9:30am to 10:00am open range
(Shown with Extend setting on)
Open Range Gap
The open range Gap is the difference between the 4:15pm close and the 9:30am open.
(Shown with Extend setting on)
https://www.tradingview.com/x/jAy3OeCR/
Time of Day Levels
The Midnight, 8:30am, and 9:30am open levels.
https://www.tradingview.com/x/ZDYJpkJx/
Daily Midnight Candle
ICT style Daily candle formation based on Midnight open
https://www.tradingview.com/x/FBRNgQJg/
リリースノート
Big fixes: Some minor display issues.リリースノート
Bug Fix: Fix for daily midnight candle colorリリースノート
UPDATE:1. Added the option to show multiple daily candles based on Midnight open
2. Adjusted NY Killzone from 7-10 to 8:30-11 to match Index futures
リリースノート
Bug Fix: bug fix related to array sizeリリースノート
UPDATE: Added possible ADR Range based on previous True days data.- Green/Up bar represents the possible upside range if price is to rally
- Red/Down bar represents the possible downside range if price is to drop
- When the two bars meet in the middle, then the average daily range has met or exceeded the ADR based on the defined lookback period
ICT teaches to use previous 5 ADR days to calculate possible daily range. It is possible for the range to far exceed the average range. Use the range for guidance only.
Note: Script does not yet exclude Sunday data and that may alter the final results. However, since it is an average and price will not hit the ADR range exactly, it should not be a major factor.
リリースノート
Bugfix:1. Fixed an issue with the ADR range calculation
2. Fixed an issue where Show/Hide ADR is not hiding the ADR range
リリースノート
Update:- Adjusted the ADR calculation to be a fixed 5 day range and ignore weekends to be consistent with ICT teachings.
- Added Trace lines and labels (Credit to toodegrees for the idea, based on his indicator)
- Added 30% ADR potential turn point based on Midnight open.
The concept is simple. The projected move of the price is based on the past 5 ADR (Average Daily Range). It is calculated based on the ICT midnight candle, not daily candle.
As the price makes new low, or new high, the top and bottom range is recalculated to reflect that.
The 30% from midnight range is a potential turning point, however it should not be assumed price will turn at that point. Similarly, it should not be assumed that price will reach or stop at the 5ADR range. these are simply guidelines.
オープンソーススクリプト
TradingViewの精神に則り、このスクリプトの作者はコードをオープンソースとして公開してくれました。トレーダーが内容を確認・検証できるようにという配慮です。作者に拍手を送りましょう!無料で利用できますが、コードの再公開はハウスルールに従う必要があります。
免責事項
この情報および投稿は、TradingViewが提供または推奨する金融、投資、トレード、その他のアドバイスや推奨を意図するものではなく、それらを構成するものでもありません。詳細は利用規約をご覧ください。
オープンソーススクリプト
TradingViewの精神に則り、このスクリプトの作者はコードをオープンソースとして公開してくれました。トレーダーが内容を確認・検証できるようにという配慮です。作者に拍手を送りましょう!無料で利用できますが、コードの再公開はハウスルールに従う必要があります。
免責事項
この情報および投稿は、TradingViewが提供または推奨する金融、投資、トレード、その他のアドバイスや推奨を意図するものではなく、それらを構成するものでもありません。詳細は利用規約をご覧ください。