OPEN-SOURCE SCRIPT
Kolmogorov-Smirnov Test
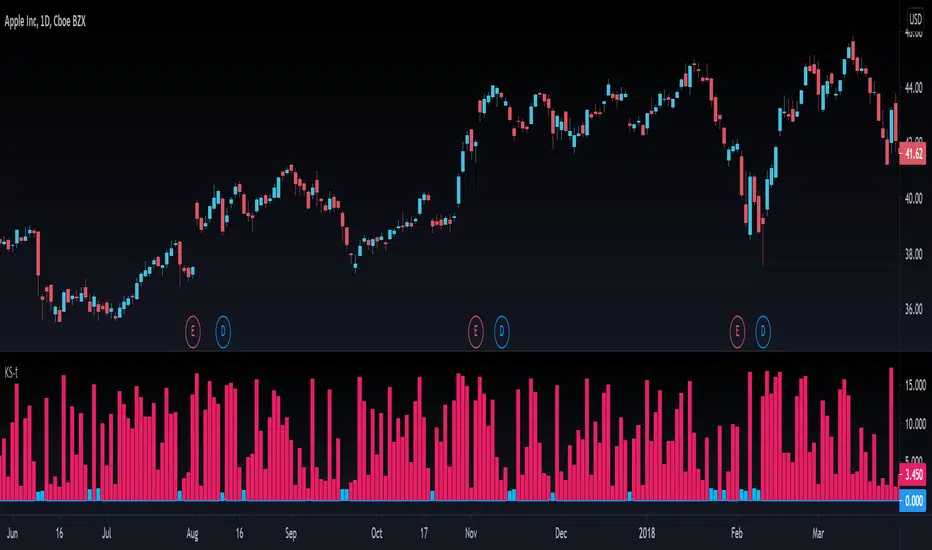
The Kolmogorov–Smirnov test aims to tell you if the distribution of prices (or log returns) tends to follow a normal distribution or not. You can read about this test on Wikipedia. It seems to be a basic but trusted measure in the quantitative trading world.
When KS-t columns are blue, then it's safe to assume normal distribution. When they are red, the normal distribution assumption is proven wrong by the magnitude of the KS-t value.
In the plotting tab of the script, you can activate another option that displays the probability of the distribution being actually normal. It's values are bounded between 0 and 1, like all probabilities.
This test can be useful when using statistical concepts for trading markets, like standard deviations, z-scores, etc because they all depend on the assumption of prices (or log returns) being normaly distributed.
If you see something wrong, don't hesitate to message me.
Happy trading to all.
オープンソーススクリプト
TradingViewの精神に則り、このスクリプトの作者はコードをオープンソースとして公開してくれました。トレーダーが内容を確認・検証できるようにという配慮です。作者に拍手を送りましょう!無料で利用できますが、コードの再公開はハウスルールに従う必要があります。
免責事項
この情報および投稿は、TradingViewが提供または推奨する金融、投資、トレード、その他のアドバイスや推奨を意図するものではなく、それらを構成するものでもありません。詳細は利用規約をご覧ください。
オープンソーススクリプト
TradingViewの精神に則り、このスクリプトの作者はコードをオープンソースとして公開してくれました。トレーダーが内容を確認・検証できるようにという配慮です。作者に拍手を送りましょう!無料で利用できますが、コードの再公開はハウスルールに従う必要があります。
免責事項
この情報および投稿は、TradingViewが提供または推奨する金融、投資、トレード、その他のアドバイスや推奨を意図するものではなく、それらを構成するものでもありません。詳細は利用規約をご覧ください。