PINE LIBRARY
StrategyDashboard
Library ”StrategyDashboard”
Hey, everybody!
I haven’t done anything here for a long time, I need to get better ^^.
In my strategies, so far private, but not about that, I constantly use dashboards, which clearly show how my strategy is working out.
Of course, you can also find a number of these parameters in the standard strategy window, but I prefer to display everything on the screen, rather than digging through a bunch of boxes and dropdowns.
At the moment I am using 2 dashboards, which I would like to share with you.
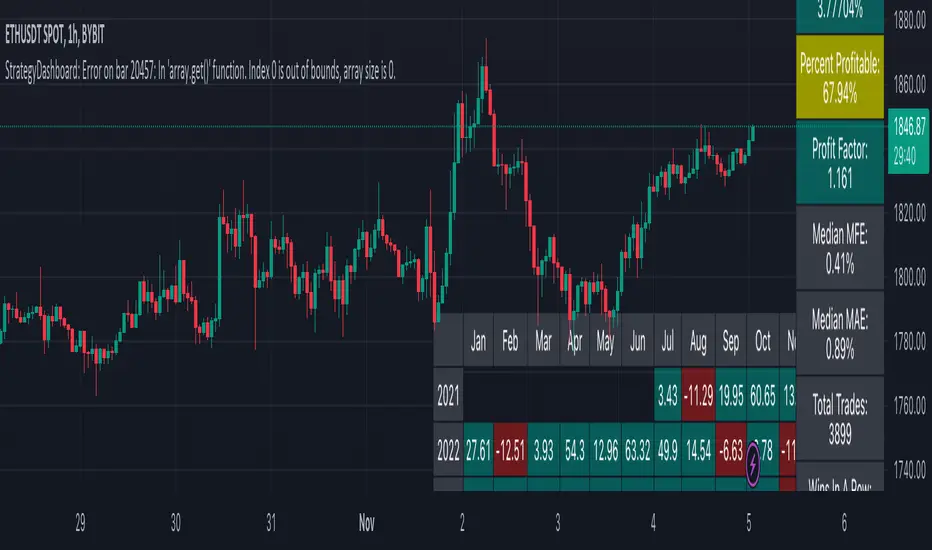
1. monthly(isShow)
this is a dashboard with the breakdown of profit by month in per cent. That is, it displays how much percentage you made or lost in a particular month, as well as for the year as a whole.
Parameters:
isShow (bool) - determine allowance to display or not.
2. total(isShow)
The second dashboard displays more of the standard strategy information, but in a table format. Information from the series “number of consecutive losers, number of consecutive wins, amount of earnings per day, etc.”.
Parameters:
isShow (bool) - determine allowance to display or not.
Since I prefer the dark theme of the interface, now they are adapted to it, but in the near future for general convenience I will add the ability to adapt to light.
The same goes for the colour scheme, now it is adapted to the one I use in my strategies (because the library with more is made by cutting these dashboards from my strategies), but will also make customisable part.
If you have any wishes, feel free to write in the comments, maybe I can implement and add them in the next versions.
Hey, everybody!
I haven’t done anything here for a long time, I need to get better ^^.
In my strategies, so far private, but not about that, I constantly use dashboards, which clearly show how my strategy is working out.
Of course, you can also find a number of these parameters in the standard strategy window, but I prefer to display everything on the screen, rather than digging through a bunch of boxes and dropdowns.
At the moment I am using 2 dashboards, which I would like to share with you.
1. monthly(isShow)
this is a dashboard with the breakdown of profit by month in per cent. That is, it displays how much percentage you made or lost in a particular month, as well as for the year as a whole.
Parameters:
isShow (bool) - determine allowance to display or not.
2. total(isShow)
The second dashboard displays more of the standard strategy information, but in a table format. Information from the series “number of consecutive losers, number of consecutive wins, amount of earnings per day, etc.”.
Parameters:
isShow (bool) - determine allowance to display or not.
Since I prefer the dark theme of the interface, now they are adapted to it, but in the near future for general convenience I will add the ability to adapt to light.
The same goes for the colour scheme, now it is adapted to the one I use in my strategies (because the library with more is made by cutting these dashboards from my strategies), but will also make customisable part.
If you have any wishes, feel free to write in the comments, maybe I can implement and add them in the next versions.
Pineライブラリ
TradingViewの精神に則り、作者はこのPineコードをオープンソースライブラリとして公開してくれました。コミュニティの他のPineプログラマーが再利用できるようにという配慮です。作者に拍手を!このライブラリは個人利用や他のオープンソースの公開コンテンツで使用できますが、公開物でのコードの再利用はハウスルールに準じる必要があります。
免責事項
この情報および投稿は、TradingViewが提供または推奨する金融、投資、トレード、その他のアドバイスや推奨を意図するものではなく、それらを構成するものでもありません。詳細は利用規約をご覧ください。
Pineライブラリ
TradingViewの精神に則り、作者はこのPineコードをオープンソースライブラリとして公開してくれました。コミュニティの他のPineプログラマーが再利用できるようにという配慮です。作者に拍手を!このライブラリは個人利用や他のオープンソースの公開コンテンツで使用できますが、公開物でのコードの再利用はハウスルールに準じる必要があります。
免責事項
この情報および投稿は、TradingViewが提供または推奨する金融、投資、トレード、その他のアドバイスや推奨を意図するものではなく、それらを構成するものでもありません。詳細は利用規約をご覧ください。