OPEN-SOURCE SCRIPT
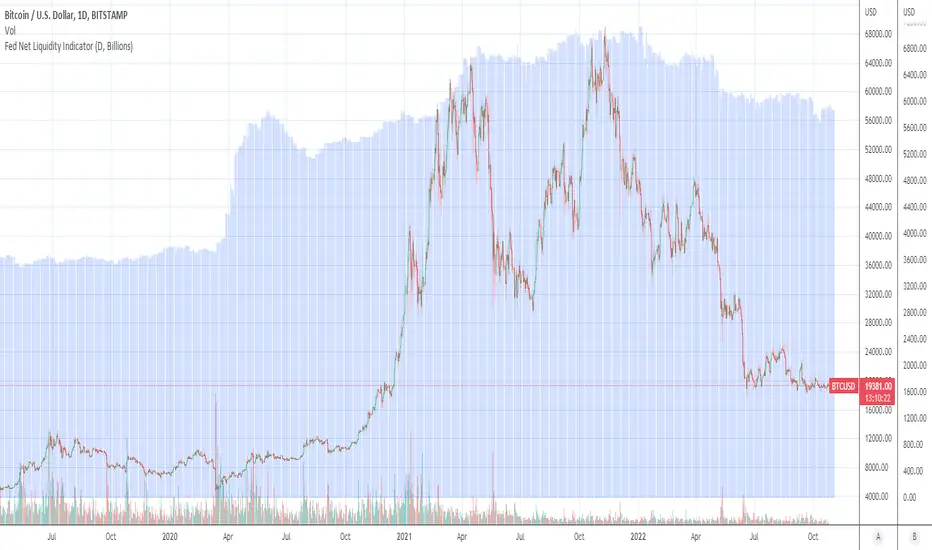
Fed Net Liquidity Indicator (24-Oct-2022 update)

This indicator is an implementation of the USD Liquidity Index originally proposed by Arthur Hayes based on the initial implementation of jlb05013, kudos to him!
I have incorporated subsequent additions (Standing Repo Facility and Central Bank Liquidity Swaps lines) and dealt with some recent changes in reporting units from TradingView.
This is a macro indicator that aims at tracking how much USD liquidity is available to chase financial assets:
- When the FED is expanding liquidity, financial asset prices tend to increase
- When the FED is contracting liquidity, financial asset prices tend to decrease
Here is the current calculation:
Net Liquidity =
(+) The Fed’s Balance Sheet (FRED:WALCL)
(-) NY Fed Total Amount of Accepted Reverse Repo Bids (FRED:RRPONTTLD)
(-) US Treasury General Account Balance Held at NY Fed (FRED:WTREGEN)
(+) NY Fed - Standing Repo Facility (FRED:RPONTSYD)
(+) NY Fed - Central Bank Liquidity Swaps (FRED:SWPT)
オープンソーススクリプト
TradingViewの精神に則り、このスクリプトの作者はコードをオープンソースとして公開してくれました。トレーダーが内容を確認・検証できるようにという配慮です。作者に拍手を送りましょう!無料で利用できますが、コードの再公開はハウスルールに従う必要があります。
免責事項
この情報および投稿は、TradingViewが提供または推奨する金融、投資、トレード、その他のアドバイスや推奨を意図するものではなく、それらを構成するものでもありません。詳細は利用規約をご覧ください。
オープンソーススクリプト
TradingViewの精神に則り、このスクリプトの作者はコードをオープンソースとして公開してくれました。トレーダーが内容を確認・検証できるようにという配慮です。作者に拍手を送りましょう!無料で利用できますが、コードの再公開はハウスルールに従う必要があります。
免責事項
この情報および投稿は、TradingViewが提供または推奨する金融、投資、トレード、その他のアドバイスや推奨を意図するものではなく、それらを構成するものでもありません。詳細は利用規約をご覧ください。