OPEN-SOURCE SCRIPT
更新済 Day Week Month High & Low
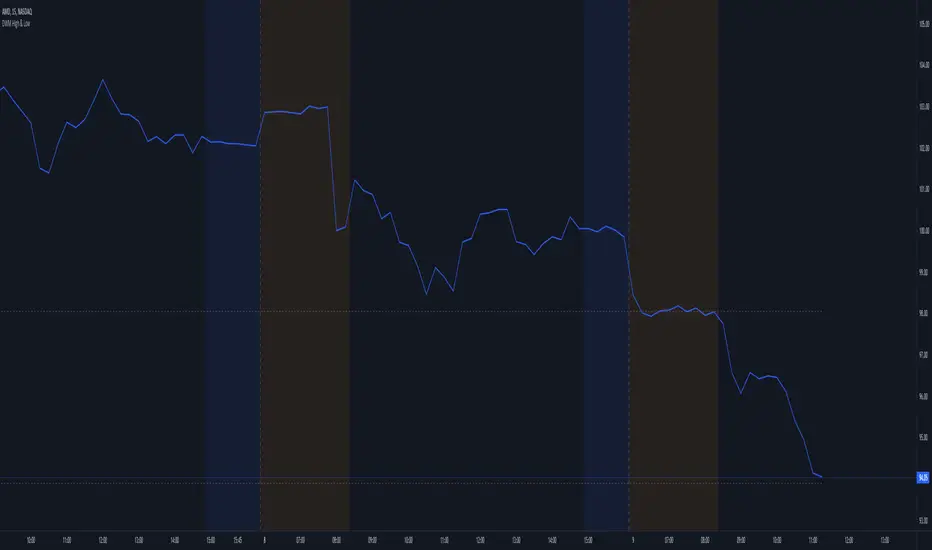
This is a small little script that helps visually mark the high and lows of the DAY, WEEK or MONTH (of your choosing). It's best when paired with my High and Low Fibonacci Pivot Points indicator to help emphasize the high and lows of the day, week or month.
リリースノート
Added a 2-Day high and low setting. This was added as an inquiry about a modification for a 2-Day high and low.リリースノート
Added some additional visual updates. I wasn't planning on releasing any additional updates, since I keep getting hit with infractions for my scripts being deemed as not original (although it's 100% my own work), nor not colorful/exciting to look at. Since, I've been receiving kind feedbacks from a user or two, I've released this update to the public.Updates Include:
- Allowing you to choose the line style (dashed, dotted or solid)
- Added an additional 1-Hour timeframe selection (for those who like to scalp with tight entries & stops)
- For those who set the timeframe to DAY, can choose to enable the lines to alternate to a different color, when the DAY high matches the WEEK high and the same is applied when the DAY low matches the WEEK low. This could be useful for those who swing trade on a weekly basis (i.e. open & close trades within the same week).
オープンソーススクリプト
TradingViewの精神に則り、このスクリプトの作者はコードをオープンソースとして公開してくれました。トレーダーが内容を確認・検証できるようにという配慮です。作者に拍手を送りましょう!無料で利用できますが、コードの再公開はハウスルールに従う必要があります。
免責事項
この情報および投稿は、TradingViewが提供または推奨する金融、投資、トレード、その他のアドバイスや推奨を意図するものではなく、それらを構成するものでもありません。詳細は利用規約をご覧ください。
オープンソーススクリプト
TradingViewの精神に則り、このスクリプトの作者はコードをオープンソースとして公開してくれました。トレーダーが内容を確認・検証できるようにという配慮です。作者に拍手を送りましょう!無料で利用できますが、コードの再公開はハウスルールに従う必要があります。
免責事項
この情報および投稿は、TradingViewが提供または推奨する金融、投資、トレード、その他のアドバイスや推奨を意図するものではなく、それらを構成するものでもありません。詳細は利用規約をご覧ください。