OPEN-SOURCE SCRIPT
Equal Highs and Equal Lows
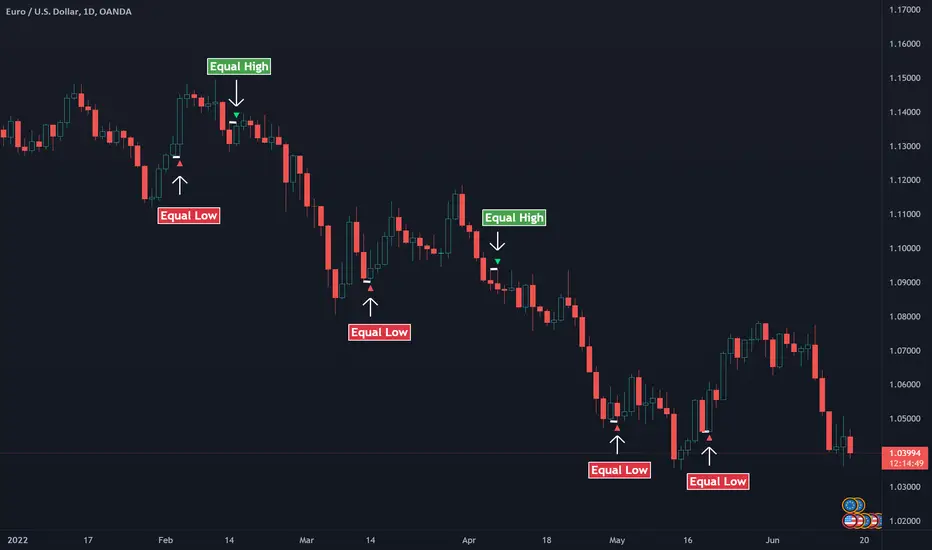
A simple indicator that detects if two candles lows or highs are equal. The pattern simply indicates the possibility of a reversal. However, many traders also use the Equal highs/lows within a broader context of market analysis to provide insights for trend traders, especially to detect pullbacks.
Equal Highs/Lows are a pattern that can indicate a shift in a trend direction or to find pullbacks within an established trend. The idea behind the equal highs and lows is that the first candle shows a strong move in the current direction, and the second candle pauses the previous candlestick price action. It's a clear sign that the momentum is slowing down. This insight is valuable for traders and can detect a potential change in the trend direction.
Usage
Disclaimer: No financial advice, only for educational/entertainment purposes.
Equal Highs/Lows are a pattern that can indicate a shift in a trend direction or to find pullbacks within an established trend. The idea behind the equal highs and lows is that the first candle shows a strong move in the current direction, and the second candle pauses the previous candlestick price action. It's a clear sign that the momentum is slowing down. This insight is valuable for traders and can detect a potential change in the trend direction.
Usage
- Use the pattern to find reversals.
- Use the pattern to find pullbacks.
Disclaimer: No financial advice, only for educational/entertainment purposes.
オープンソーススクリプト
TradingViewの精神に則り、このスクリプトの作者はコードをオープンソースとして公開してくれました。トレーダーが内容を確認・検証できるようにという配慮です。作者に拍手を送りましょう!無料で利用できますが、コードの再公開はハウスルールに従う必要があります。
免責事項
この情報および投稿は、TradingViewが提供または推奨する金融、投資、トレード、その他のアドバイスや推奨を意図するものではなく、それらを構成するものでもありません。詳細は利用規約をご覧ください。
オープンソーススクリプト
TradingViewの精神に則り、このスクリプトの作者はコードをオープンソースとして公開してくれました。トレーダーが内容を確認・検証できるようにという配慮です。作者に拍手を送りましょう!無料で利用できますが、コードの再公開はハウスルールに従う必要があります。
免責事項
この情報および投稿は、TradingViewが提供または推奨する金融、投資、トレード、その他のアドバイスや推奨を意図するものではなく、それらを構成するものでもありません。詳細は利用規約をご覧ください。