OPEN-SOURCE SCRIPT
RSI c/w MA, ADX and ATR data
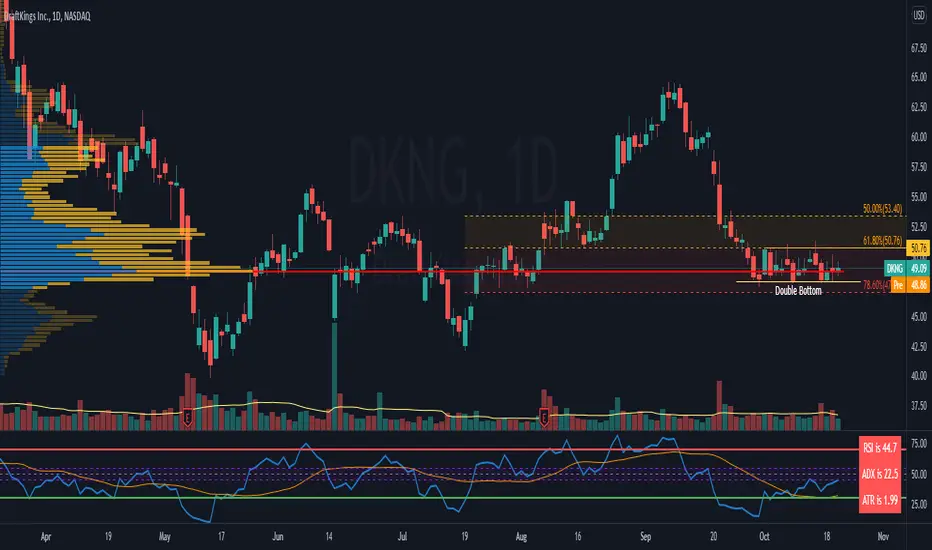
I have added 3 items to the RSI indicator which helps me to get more information at the same time.
1) ADX value - when ADX is above 25 we have a strong trend
2) ATR Value - helps me to calculate my daily targets and stop-loss levels at a glance.
3) A simple moving average - This shows me the trend of RSI. If the price breaks a trend line and at the same time RSI crosses above the MA, it shows me a breakout has happened. In longer timeframes, it can show you in advance if you should expect a reversal in the trend.
You can turn on or off the MA as well as the ADX line.
オープンソーススクリプト
TradingViewの精神に則り、このスクリプトの作者はコードをオープンソースとして公開してくれました。トレーダーが内容を確認・検証できるようにという配慮です。作者に拍手を送りましょう!無料で利用できますが、コードの再公開はハウスルールに従う必要があります。
免責事項
この情報および投稿は、TradingViewが提供または推奨する金融、投資、トレード、その他のアドバイスや推奨を意図するものではなく、それらを構成するものでもありません。詳細は利用規約をご覧ください。
オープンソーススクリプト
TradingViewの精神に則り、このスクリプトの作者はコードをオープンソースとして公開してくれました。トレーダーが内容を確認・検証できるようにという配慮です。作者に拍手を送りましょう!無料で利用できますが、コードの再公開はハウスルールに従う必要があります。
免責事項
この情報および投稿は、TradingViewが提供または推奨する金融、投資、トレード、その他のアドバイスや推奨を意図するものではなく、それらを構成するものでもありません。詳細は利用規約をご覧ください。