OPEN-SOURCE SCRIPT
Sideways Market Detector with High/Low NJR
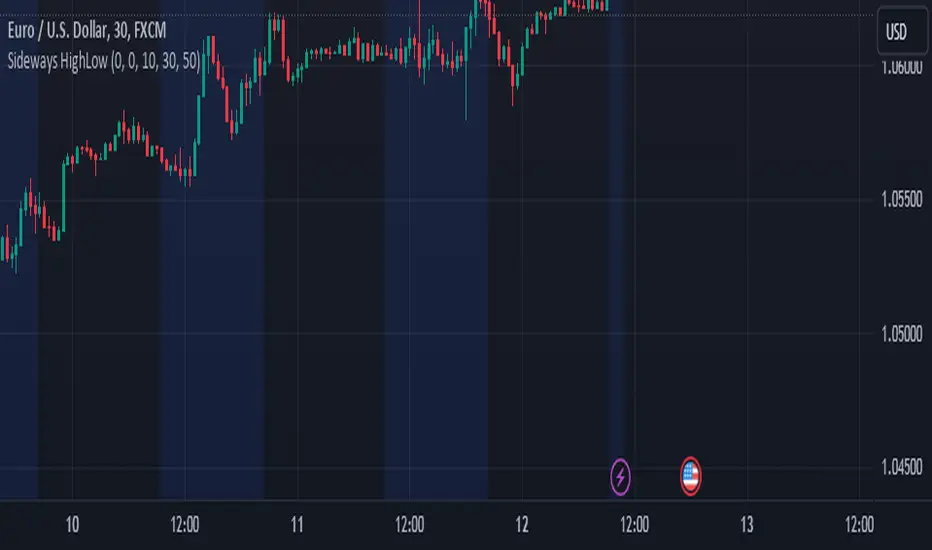
Calculate the range as the difference between the high and low prices.
The maxRange input to specify the maximum allowable range that defines a sideways market.
The background color is set to blue during sideways market conditions, and it's transparent to some extent (transp=90). When the market is not sideways, the background color is not changed.
The indicator marks the start and end of the session with red triangles.
When the price range (high - low) is within the specified threshold, the indicator will indicate a sideways market with a blue background.
オープンソーススクリプト
TradingViewの精神に則り、このスクリプトの作者はコードをオープンソースとして公開してくれました。トレーダーが内容を確認・検証できるようにという配慮です。作者に拍手を送りましょう!無料で利用できますが、コードの再公開はハウスルールに従う必要があります。
免責事項
この情報および投稿は、TradingViewが提供または推奨する金融、投資、トレード、その他のアドバイスや推奨を意図するものではなく、それらを構成するものでもありません。詳細は利用規約をご覧ください。
オープンソーススクリプト
TradingViewの精神に則り、このスクリプトの作者はコードをオープンソースとして公開してくれました。トレーダーが内容を確認・検証できるようにという配慮です。作者に拍手を送りましょう!無料で利用できますが、コードの再公開はハウスルールに従う必要があります。
免責事項
この情報および投稿は、TradingViewが提供または推奨する金融、投資、トレード、その他のアドバイスや推奨を意図するものではなく、それらを構成するものでもありません。詳細は利用規約をご覧ください。