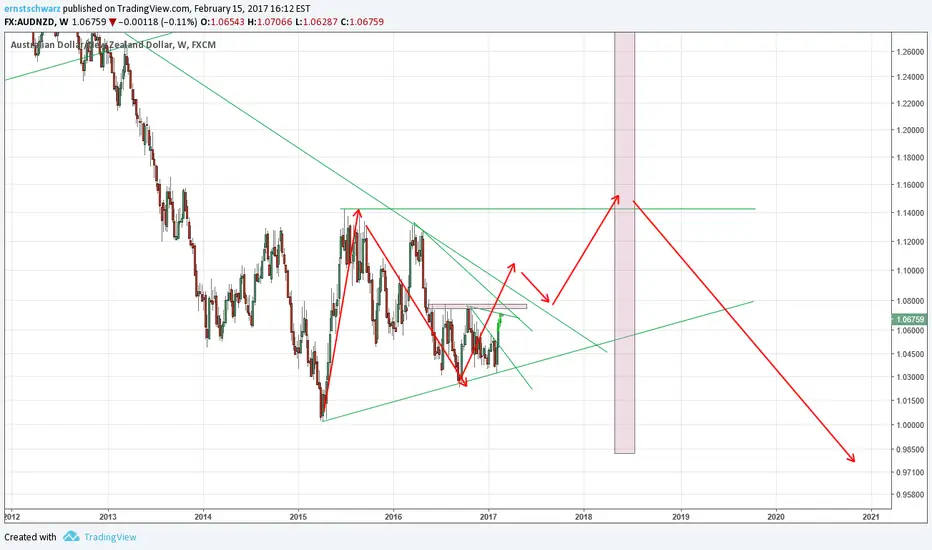
Let s assume a 3 wave corrective structure for more downside.
Easiest is to assume that the first high is taken and then downside.
I have a time prediction projected in the chart for a big change to come.
Let me know what you think.
Easiest is to assume that the first high is taken and then downside.
I have a time prediction projected in the chart for a big change to come.
Let me know what you think.
ノート
Please keep in mind that this Chart / arrows in the chart represent an corrective structure in development.The first red up-arrow could be an impulse move to the upside and believing this would lead to a different expectation!
ノート
Here is the same chart with additional alternative scenario (blue arrows, suggesting we are no longer in the bigger correction)免責事項
これらの情報および投稿は、TradingViewが提供または保証する金融、投資、取引、またはその他の種類のアドバイスや推奨を意図したものではなく、またそのようなものでもありません。詳しくは利用規約をご覧ください。
免責事項
これらの情報および投稿は、TradingViewが提供または保証する金融、投資、取引、またはその他の種類のアドバイスや推奨を意図したものではなく、またそのようなものでもありません。詳しくは利用規約をご覧ください。