CELG forms 3 weeks tight
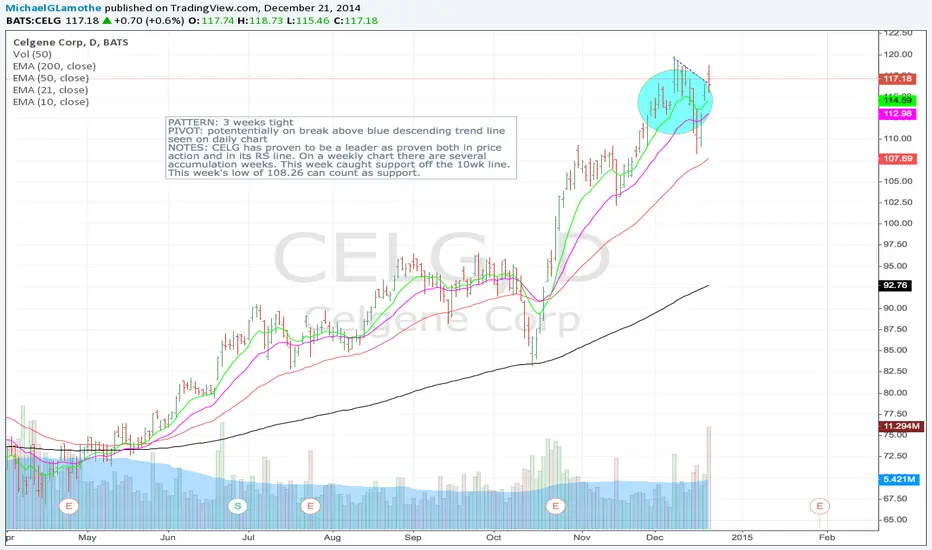
PATTERN: 3 weeks tight
PIVOT: potententially on break above blue descending trend line seen on daily chart
NOTES: CELG has proven to be a leader as proven both in price action and in its RS line. On a weekly chart there are several accumulation weeks. This week caught support off the 10wk line. This week's low of 108.26 can count as support.
免責事項
これらの情報および投稿は、TradingViewが提供または保証する金融、投資、取引、またはその他の種類のアドバイスや推奨を意図したものではなく、またそのようなものでもありません。詳しくは利用規約をご覧ください。
免責事項
これらの情報および投稿は、TradingViewが提供または保証する金融、投資、取引、またはその他の種類のアドバイスや推奨を意図したものではなく、またそのようなものでもありません。詳しくは利用規約をご覧ください。