The weekly chart of CL shows a divergence of MACD lines and sort of a divergence of the histogram. Both Force Indexes are lower than they were at the last swing high. 
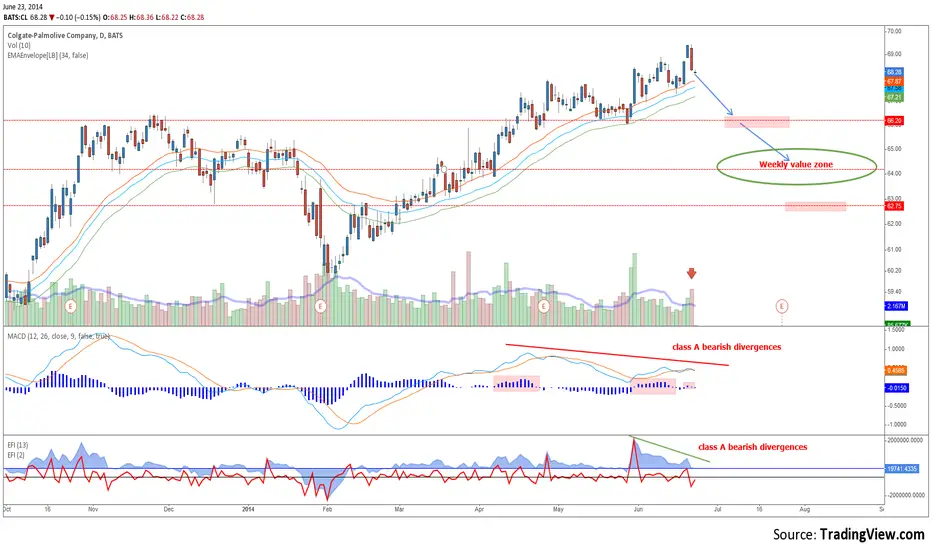
The daily chart has a closing marubozu candle, which might signal the start of the correction, note also the high volume. MACD lines and histogram show a class A bearish divergence, and so do both Force Indexes. First support comes at 66$. There is good support at 64$, where the weekly Wave stands approximately. That will be a level to watch closely if this correction is coming
The daily chart has a closing marubozu candle, which might signal the start of the correction, note also the high volume. MACD lines and histogram show a class A bearish divergence, and so do both Force Indexes. First support comes at 66$. There is good support at 64$, where the weekly Wave stands approximately. That will be a level to watch closely if this correction is coming
免責事項
この情報および投稿は、TradingViewが提供または推奨する金融、投資、トレード、その他のアドバイスや推奨を意図するものではなく、それらを構成するものでもありません。詳細は利用規約をご覧ください。
免責事項
この情報および投稿は、TradingViewが提供または推奨する金融、投資、トレード、その他のアドバイスや推奨を意図するものではなく、それらを構成するものでもありません。詳細は利用規約をご覧ください。