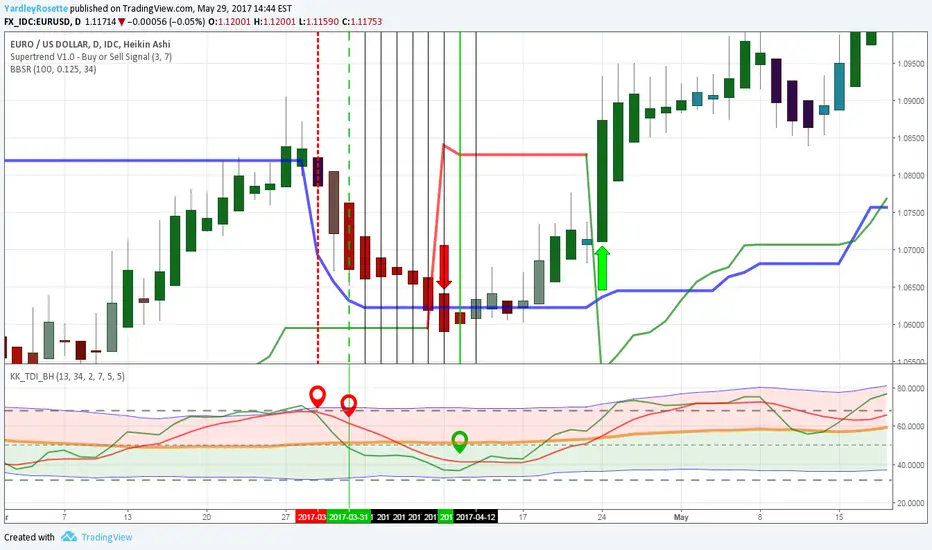
RSI/TSI cross down signal ocurred.
RSI/TSI remains bearish, though 1H Dynamic Index indication, simple/generic buy entry conditions/rules of:
RSI/TSI having been oversold, MBL risen from near 32, & RSI/TSI cross MBL up & RSI to cross above Volatility Band High were met.
Lower Time Frames indicate bullish movement within Daily chart.
Daily chart RSI/TSI cross up follows, bullish trend>>
免責事項
これらの情報および投稿は、TradingViewが提供または保証する金融、投資、取引、またはその他の種類のアドバイスや推奨を意図したものではなく、またそのようなものでもありません。詳しくは利用規約をご覧ください。
免責事項
これらの情報および投稿は、TradingViewが提供または保証する金融、投資、取引、またはその他の種類のアドバイスや推奨を意図したものではなく、またそのようなものでもありません。詳しくは利用規約をご覧ください。