Part 1 : Direction
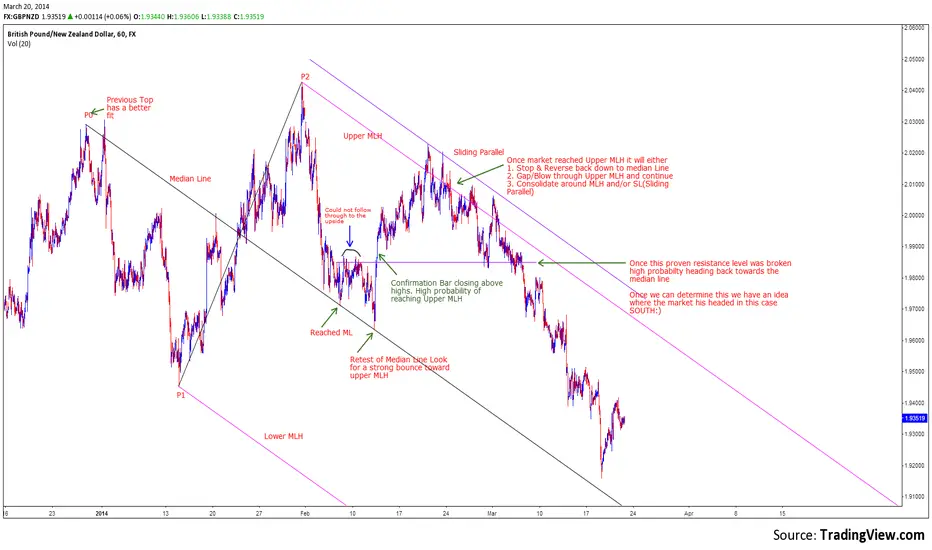
This is a 60 minute chart of the GBP/NZD pair. It was drawn after the first touch of the median line.
The horizontal purple support & resistance line within the median line set gives us directional bias as to market direction. In part two I will zoom in closer and see what the forks are telling me.
This is a 60 minute chart of the GBP/NZD pair. It was drawn after the first touch of the median line.
The horizontal purple support & resistance line within the median line set gives us directional bias as to market direction. In part two I will zoom in closer and see what the forks are telling me.
免責事項
これらの情報および投稿は、TradingViewが提供または保証する金融、投資、取引、またはその他の種類のアドバイスや推奨を意図したものではなく、またそのようなものでもありません。詳しくは利用規約をご覧ください。
免責事項
これらの情報および投稿は、TradingViewが提供または保証する金融、投資、取引、またはその他の種類のアドバイスや推奨を意図したものではなく、またそのようなものでもありません。詳しくは利用規約をご覧ください。