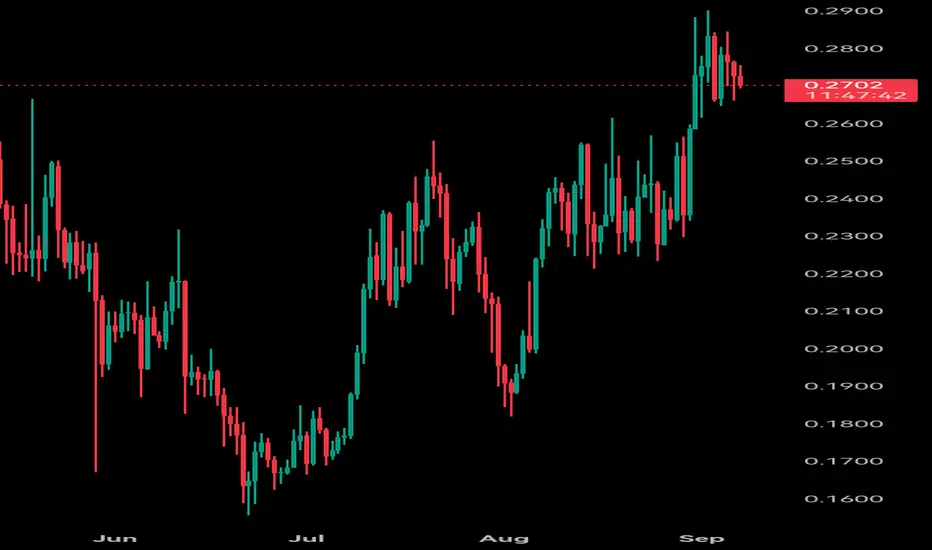
**Polygon (MATICUSD) Technical Analysis**
MATIC is currently testing a critical support cluster between **$0.52-$0.54**, a zone that has provided both psychological and technical support throughout 2024. The price remains constrained under key moving averages, with the 50-day MA at **$0.58** and 200-day MA at **$0.64** creating dynamic resistance layers. Trading volume has shown characteristic weakness during declines, suggesting lack of aggressive selling but equally absent buying enthusiasm.
The daily RSI oscillates near **39**, approaching oversold territory yet lacking definitive reversal signals. The MACD continues to trade below its signal line, though the histogram displays early signs of convergence, indicating potential slowing of downward momentum. Immediate resistance awaits at **$0.58** (50-day MA), with more significant resistance at the **$0.62** Fibonacci retracement level.
Fundamentally, Polygon continues to demonstrate robust ecosystem growth with increasing institutional adoption in tokenized assets and sustained developer activity. The network's recent technological upgrades and strategic partnerships provide underlying strength, though these positive developments remain overshadowed by broader market sentiment. A decisive break below **$0.52** could trigger accelerated selling toward the **$0.48** support level. Conversely, a reclaim of **$0.58** with expanding volume could signal near-term bottom formation and potential retest of higher resistance zones. Traders should monitor Ethereum's performance for directional cues, given MATIC's high correlation with ETH movements. The upcoming weeks remain crucial for determining whether current levels represent accumulation or distribution territory.
免責事項
これらの情報および投稿は、TradingViewが提供または保証する金融、投資、取引、またはその他の種類のアドバイスや推奨を意図したものではなく、またそのようなものでもありません。詳しくは利用規約をご覧ください。
免責事項
これらの情報および投稿は、TradingViewが提供または保証する金融、投資、取引、またはその他の種類のアドバイスや推奨を意図したものではなく、またそのようなものでもありません。詳しくは利用規約をご覧ください。
