Hello Traders,
NIFTY50 declined the hole week to a 10620 intraday low and reversed sharply during Fridays session to a close at 10724. The candlestick pattern leave a „Hammer-candle“ but this one is a bearish one. How to interpret this behavior.
Well, by using the a/d-Ratio, which endet the day @ 0.56 we have the message tha makes sence relative to price. Decling index and declining Ratio. Using the TRIN (ARMS Index) we get another message. TRIN closed at .76 which is normally a „bullish sign“! This is in contrary to each other.
Using the intraday a/d-Ratio to price we can view, that the bottom at Fridays session got touched around noon and price reversed since to a close at 10724, and, confirming in addition, the Ratio has risen to, moving sideways within the last trading hour.
To my view the message is, that traders put a lot of buying pressure (money) into the market to keep it rising, and a shortterm bottom is in place, or it is a bull trap and NIFTY will decline after a short pullback.
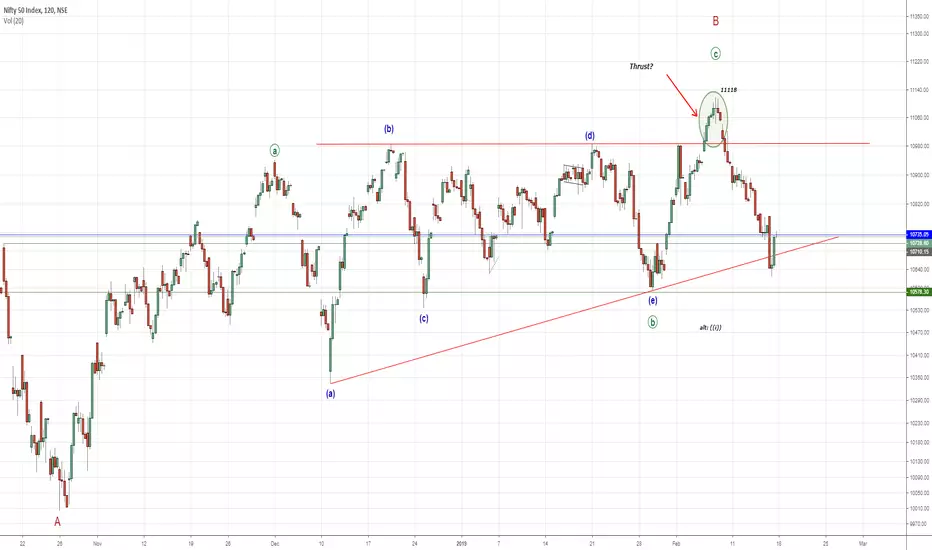
Note, at the NIFTY50 chart, that a rising trendline, connecting the lows of 1004-10583 was violated but price bounced back above this one. A decline and a daily close below that line will be a bearish sign and a door opener to lower price stil, while a decline below 10583 will increase the odds that the triangle formation is confirmed.
On the other hand, a rise above the high at 11118 will eliminate the triangle and something else is developing.
Following the Dow-Theory yoou will observe, that only NIFTY IT is howing strong behavior, while all the other indexes are showing weakness and, to my view, corrective pattern, may in a wave C of (4)! This is a "non-confirmation" as it often occurs at trend reversal points.
So, stay tuned and we will be alert if some interesting will develop. We will disucc it at this pages.
Have a great weekend.....
ruebennase
Feel free to ask or comment.
Trading this analyze is at your own risk!

NIFTY50 declined the hole week to a 10620 intraday low and reversed sharply during Fridays session to a close at 10724. The candlestick pattern leave a „Hammer-candle“ but this one is a bearish one. How to interpret this behavior.
Well, by using the a/d-Ratio, which endet the day @ 0.56 we have the message tha makes sence relative to price. Decling index and declining Ratio. Using the TRIN (ARMS Index) we get another message. TRIN closed at .76 which is normally a „bullish sign“! This is in contrary to each other.
Using the intraday a/d-Ratio to price we can view, that the bottom at Fridays session got touched around noon and price reversed since to a close at 10724, and, confirming in addition, the Ratio has risen to, moving sideways within the last trading hour.
To my view the message is, that traders put a lot of buying pressure (money) into the market to keep it rising, and a shortterm bottom is in place, or it is a bull trap and NIFTY will decline after a short pullback.
Note, at the NIFTY50 chart, that a rising trendline, connecting the lows of 1004-10583 was violated but price bounced back above this one. A decline and a daily close below that line will be a bearish sign and a door opener to lower price stil, while a decline below 10583 will increase the odds that the triangle formation is confirmed.
On the other hand, a rise above the high at 11118 will eliminate the triangle and something else is developing.
Following the Dow-Theory yoou will observe, that only NIFTY IT is howing strong behavior, while all the other indexes are showing weakness and, to my view, corrective pattern, may in a wave C of (4)! This is a "non-confirmation" as it often occurs at trend reversal points.
So, stay tuned and we will be alert if some interesting will develop. We will disucc it at this pages.
Have a great weekend.....
ruebennase
Feel free to ask or comment.
Trading this analyze is at your own risk!
免責事項
これらの情報および投稿は、TradingViewが提供または保証する金融、投資、取引、またはその他の種類のアドバイスや推奨を意図したものではなく、またそのようなものでもありません。詳しくは利用規約をご覧ください。
免責事項
これらの情報および投稿は、TradingViewが提供または保証する金融、投資、取引、またはその他の種類のアドバイスや推奨を意図したものではなく、またそのようなものでもありません。詳しくは利用規約をご覧ください。