Tempus AI  TEM is showing a text-book breakout setup on the daily chart.
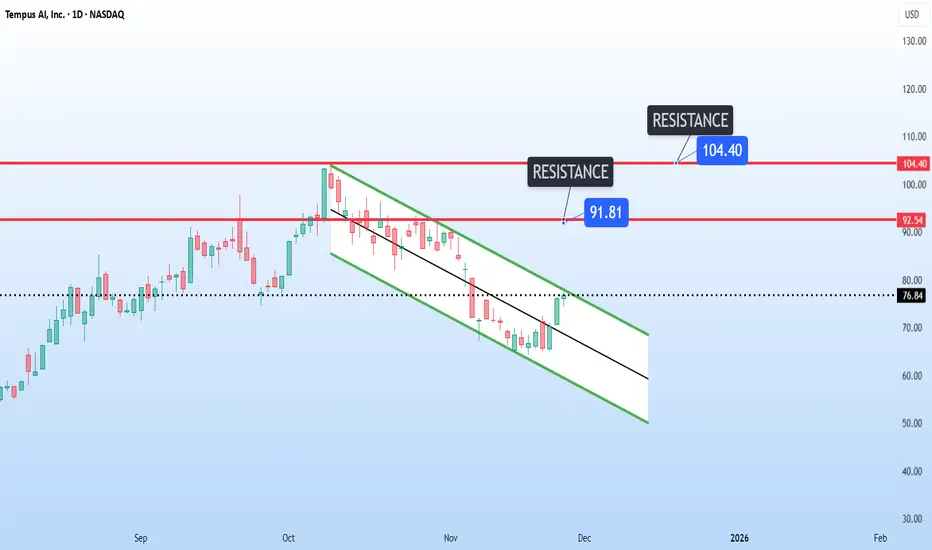
It is hovering right at the top of the descending channel at 76, putting pressure on the trendline for a potential breakout.
The next key resistance levels could be at 91 and 104.
It is hovering right at the top of the descending channel at 76, putting pressure on the trendline for a potential breakout.
The next key resistance levels could be at 91 and 104.
免責事項
この情報および投稿は、TradingViewが提供または推奨する金融、投資、トレード、その他のアドバイスや推奨を意図するものではなく、それらを構成するものでもありません。詳細は利用規約をご覧ください。
免責事項
この情報および投稿は、TradingViewが提供または推奨する金融、投資、トレード、その他のアドバイスや推奨を意図するものではなく、それらを構成するものでもありません。詳細は利用規約をご覧ください。