PROTECTED SOURCE SCRIPT
[MBBTI] BTC Thot

Hello Traders,
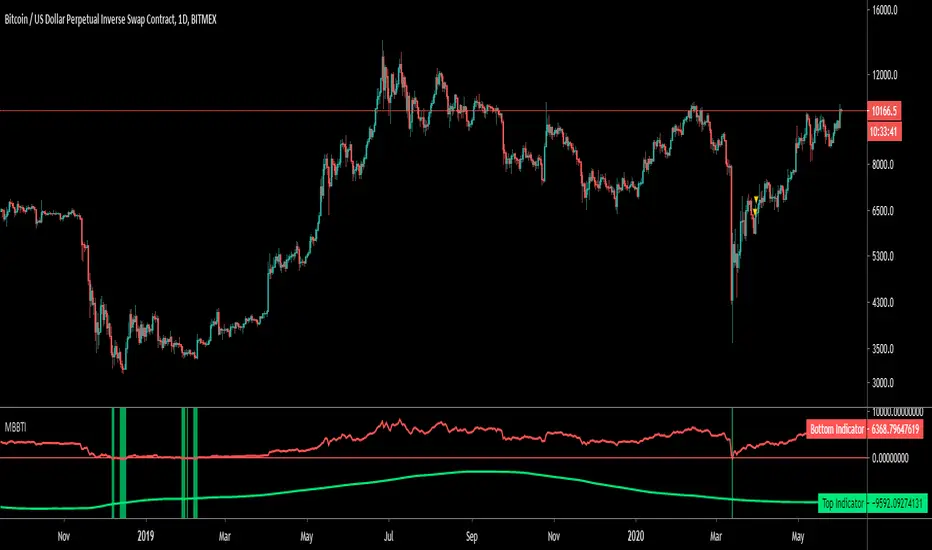
Thot is indicator which utilizes moving averages to indicate the potential high or bottom.
How it works?
- it utilizes different moving averages and weighting them with fibonacci multiples.
- some crosses proved indicating highs and lows in the past
- red indicates potential high
- green indicates potential low
- only good on daily chart
- check BLX for past performance
Note: This is based on past performance an not quarantining any future performance.
Contact me if you have any questions or change requests
Wuuzzaa
保護スクリプト
このスクリプトのソースコードは非公開で投稿されています。 ただし、制限なく自由に使用できます – 詳細はこちらでご確認ください。
免責事項
この情報および投稿は、TradingViewが提供または推奨する金融、投資、トレード、その他のアドバイスや推奨を意図するものではなく、それらを構成するものでもありません。詳細は利用規約をご覧ください。
保護スクリプト
このスクリプトのソースコードは非公開で投稿されています。 ただし、制限なく自由に使用できます – 詳細はこちらでご確認ください。
免責事項
この情報および投稿は、TradingViewが提供または推奨する金融、投資、トレード、その他のアドバイスや推奨を意図するものではなく、それらを構成するものでもありません。詳細は利用規約をご覧ください。