PROTECTED SOURCE SCRIPT
更新済 Order Flow Analysis
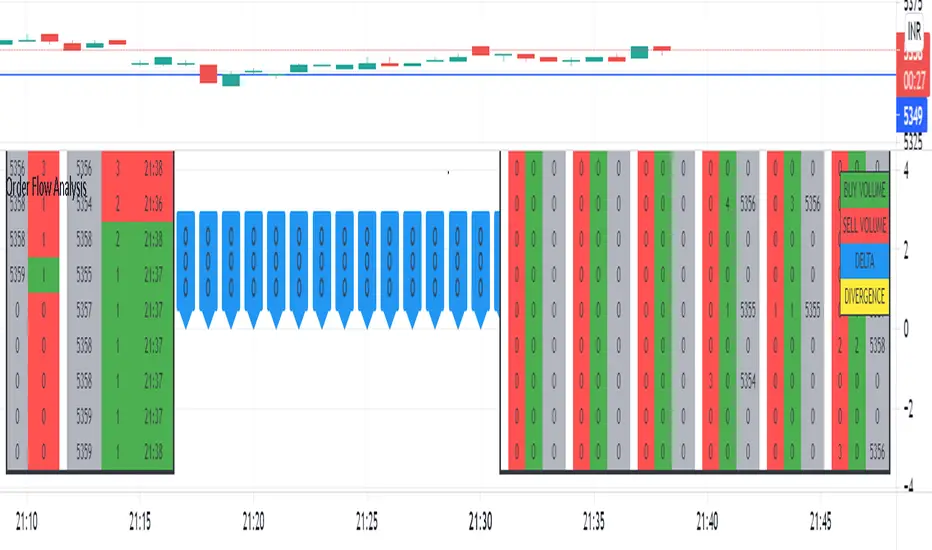
The script plots the order flow clusters for the last six candles in the middle right.
The cluster contains buy volume, sell volume and the price range of the volume.
It calculates uptick volume as buy volume and down tick volume as sell volume and calculates the delta(shown in labels). Recent ATR is considered to determine each cell price range in the cluster.
At the left side, the top volume ticks and the live ticks are displayed.
Please note this works only during market trading hours.
Do not refresh the browser tab and do not change the timeframe, which will cause a reset of numbers.
リリースノート
Delta divergences are shown in labels with yellow color. Labels are present at 0 price.Please scroll and zoom to get the delta labels.Minor enhancements and bug fixes.
リリースノート
Minor enhancements.リリースノート
converted to V5The delta bars now overlay on the chart ( can also be separated into new pane below)
Delta bars size, font size, color and number of required bars can be changed
minor improvements and fixes
Delta labels will be aligned automatically below day's low with an offset that can be changed.
保護スクリプト
このスクリプトのソースコードは非公開で投稿されています。 ただし、制限なく自由に使用できます – 詳細はこちらでご確認ください。
免責事項
この情報および投稿は、TradingViewが提供または推奨する金融、投資、トレード、その他のアドバイスや推奨を意図するものではなく、それらを構成するものでもありません。詳細は利用規約をご覧ください。
保護スクリプト
このスクリプトのソースコードは非公開で投稿されています。 ただし、制限なく自由に使用できます – 詳細はこちらでご確認ください。
免責事項
この情報および投稿は、TradingViewが提供または推奨する金融、投資、トレード、その他のアドバイスや推奨を意図するものではなく、それらを構成するものでもありません。詳細は利用規約をご覧ください。