INVITE-ONLY SCRIPT
RSI — Josh (Refined)
RSI Buy/Sell Pro — Josh (Refined)
Overview
This study enhances the classic RSI (Relative Strength Index) by adding multiple visualization layers and research tools. It helps users see overbought/oversold conditions, divergence patterns, and momentum shifts more clearly — in a way that is visually intuitive.
⚠️ Disclaimer: This script is for educational and research purposes only. It does not provide financial advice or trading recommendations. Past signals are not indicative of future results. Users remain fully responsible for their own decisions and risk management.
Key Features
Custom RSI Signals
Flexible signal modes (Strict 30/70, Loose, Aggressive 50-cross)
Optional “BUY/SELL” visual text or compact labels
Adjustable cooldown between signals
RSI Divergence Detection
Classic bullish/bearish divergence with pivot confirmation
Real-time “Shadow Divergence” preview (may repaint, by design)
Visual waterline and shaded shadow effects
MA Cross on RSI
Overlay fast/slow moving averages directly on the RSI scale
Crossovers highlighted with markers and alerts
Bollinger Aura (Glow Effect)
Bollinger Bands applied to RSI with customizable color modes
Single color, Upper/Lower, or Zone-driven bull/bear tint
Optional soft fill between bands for clarity
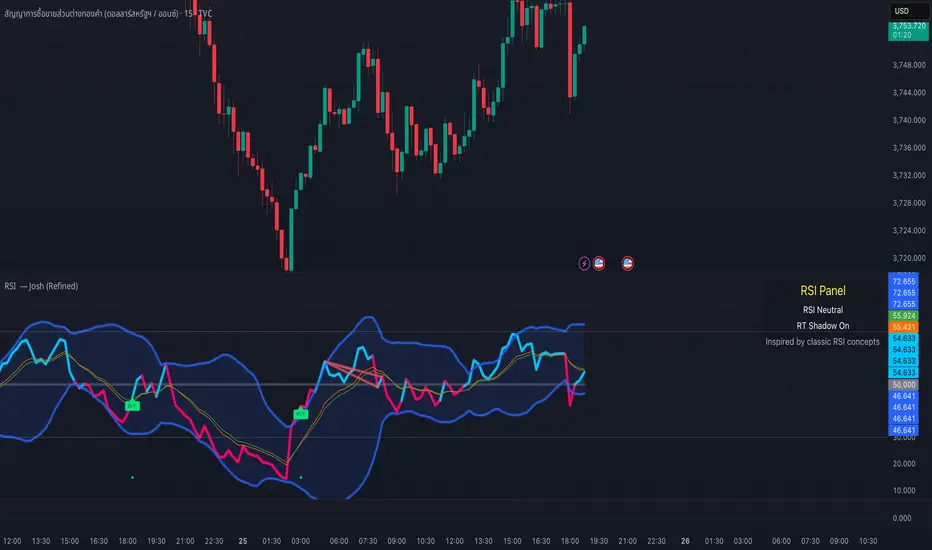
Guidance Panel
On-chart panel summarizing RSI state (OB/OS/Neutral), real-time shadow status, and credits
Alerts Included
RSI BUY / SELL cross conditions
RSI MA cross up / down
Divergence signals (classic & real-time)
Usage Notes
Designed to visualize RSI dynamics and assist in technical research
The “BUY/SELL” markers are visual study tags only — not trade calls
For best practice, combine with higher timeframe context, support/resistance, or volume analysis
Always validate ideas in a demo environment before applying to live trading
Compliance & Credits
Built in Pine Script® v5 on TradingView
Indicator name and labels are for visualization only — not investment advice
Credits: Inspired by classic RSI concepts, refined with additional visualization methods
✅ This description keeps your script compliant:
No performance guarantees
No marketing language like “make profit fast”
Clear disclaimer & educational framing
Overview
This study enhances the classic RSI (Relative Strength Index) by adding multiple visualization layers and research tools. It helps users see overbought/oversold conditions, divergence patterns, and momentum shifts more clearly — in a way that is visually intuitive.
⚠️ Disclaimer: This script is for educational and research purposes only. It does not provide financial advice or trading recommendations. Past signals are not indicative of future results. Users remain fully responsible for their own decisions and risk management.
Key Features
Custom RSI Signals
Flexible signal modes (Strict 30/70, Loose, Aggressive 50-cross)
Optional “BUY/SELL” visual text or compact labels
Adjustable cooldown between signals
RSI Divergence Detection
Classic bullish/bearish divergence with pivot confirmation
Real-time “Shadow Divergence” preview (may repaint, by design)
Visual waterline and shaded shadow effects
MA Cross on RSI
Overlay fast/slow moving averages directly on the RSI scale
Crossovers highlighted with markers and alerts
Bollinger Aura (Glow Effect)
Bollinger Bands applied to RSI with customizable color modes
Single color, Upper/Lower, or Zone-driven bull/bear tint
Optional soft fill between bands for clarity
Guidance Panel
On-chart panel summarizing RSI state (OB/OS/Neutral), real-time shadow status, and credits
Alerts Included
RSI BUY / SELL cross conditions
RSI MA cross up / down
Divergence signals (classic & real-time)
Usage Notes
Designed to visualize RSI dynamics and assist in technical research
The “BUY/SELL” markers are visual study tags only — not trade calls
For best practice, combine with higher timeframe context, support/resistance, or volume analysis
Always validate ideas in a demo environment before applying to live trading
Compliance & Credits
Built in Pine Script® v5 on TradingView
Indicator name and labels are for visualization only — not investment advice
Credits: Inspired by classic RSI concepts, refined with additional visualization methods
✅ This description keeps your script compliant:
No performance guarantees
No marketing language like “make profit fast”
Clear disclaimer & educational framing
招待専用スクリプト
このスクリプトは作者が承認したユーザーのみアクセス可能です。使用するにはアクセス申請をして許可を得る必要があります。通常は支払い後に承認されます。詳細は下記の作者の指示に従うか、JOSHSniper4569に直接お問い合わせください。
TradingViewは、作者を完全に信頼し、スクリプトの動作を理解していない限り、有料スクリプトの購入・使用を推奨しません。コミュニティスクリプトには無料のオープンソースの代替が多数あります。
作者の指示
✅ This description keeps your script compliant:
No performance guarantees
No marketing language like “make profit fast”
Clear disclaimer & educational framing
Joshsniper4569
免責事項
この情報および投稿は、TradingViewが提供または推奨する金融、投資、トレード、その他のアドバイスや推奨を意図するものではなく、それらを構成するものでもありません。詳細は利用規約をご覧ください。